What Are Maintenance KPIs? 10 Maintenance Performance Metrics to Track & Improve

Without the right data guiding your decisions, you can’t optimize any business process. Maintenance is no different.
That’s why you need to measure maintenance KPIs (key performance indicators).
These performance metrics will help guide your maintenance management process and reduce unnecessary breakdowns, excess maintenance, and inefficient crews.
In this article, we’ll break down the 10 most important maintenance KPIs, what businesses they can help, and how to improve your maintenance performance with them.
To navigate to the section which interests you the most, click below:
- What Are Maintenance KPIs?
- Why Should You Track Maintenance KPIs?
- 10 Maintenance KPIs for Your Business
- What Companies Should Focus on Maintenance KPIs?
- Improve Your Planning to Handle More Work Orders & Improve KPIs
What Are Maintenance KPIs?
Maintenance KPIs are performance metrics that help you measure how effective your overall maintenance process works.
You can use them to track the progress of your individual maintenance crews, as well as the overall performance of your entire organization.
KPIs vs Metrics
Key performance indicators (KPIs) aren’t just metrics. They don’t just measure the numbers. They show how effectively you’re performing a specific business function.
For example, the percentage of work orders solved on the first try shows the efficiency of your planned maintenance and whether your crews are working fast enough.
A metric is just a simple data point that doesn’t have any innate meaning. Your total number of maintenance technicians doesn’t indicate performance, but it is a metric.
Why Should You Track Maintenance KPIs?
Maintenance is a significant expense for any company that owns a lot of valuable equipment.
Can a single breakdown stop or negatively impact your production life cycle? You need to be tracking maintenance KPIs.
And it’s not just a problem in manufacturing, pipelines, or other large-scale industrial endeavors. Even trucking companies can end up spending a lot on maintenance. According to the Truckers Report, companies may spend up to $15,000 per year on a single truck.
Maintenance KPIs help you keep your maintenance costs low while also avoiding unplanned downtime.
10 Maintenance KPIs for Your Business
The key to effective maintenance management is data.
Use the following KPIs to keep your maintenance operations functioning as efficiently as possible.
Maintenance order backlog
The backlog is the number of maintenance work orders outstanding at any point in time.
If your crews aren’t handling enough maintenance tasks, the backlog will only keep growing. That means you need to either expand your team or improve efficiency.
Total maintenance orders handled
This metric shows the volume of work your crews do.
It’s the most basic KPI for measuring the output of a planned preventive maintenance program. If you’re working to improve efficiency, this number should go up.
It’s impossible to give benchmarks here, as that’s 100% dependent on company size, industry, and more.
Work orders handled on first schedule
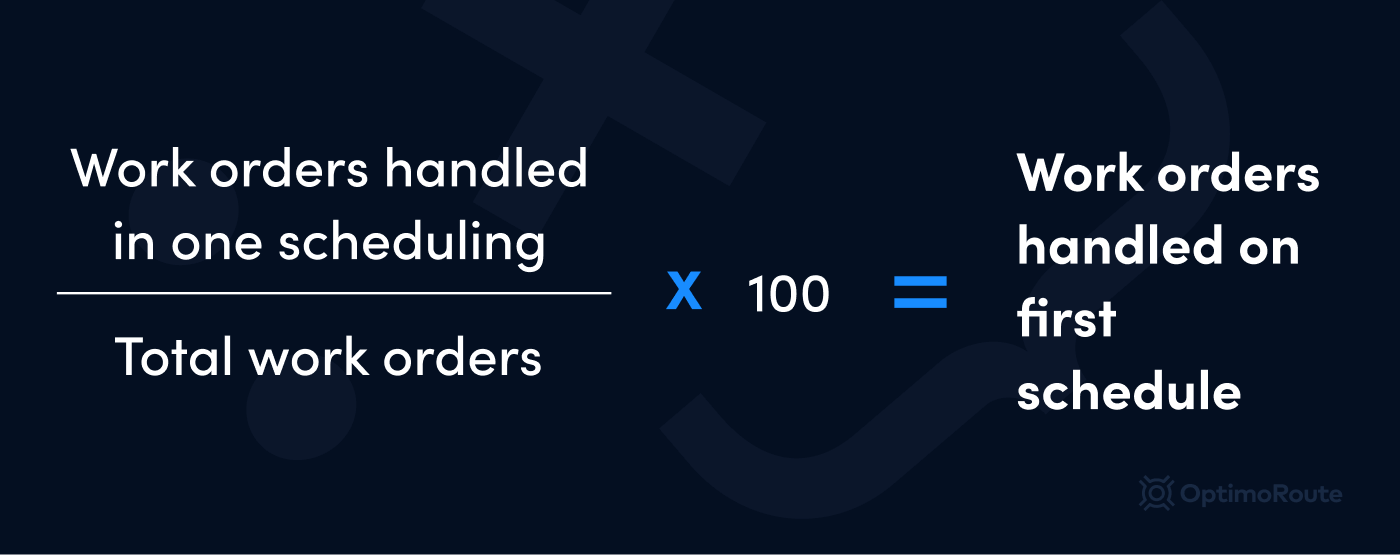
The % of work orders handled on the first schedule is an essential management and planning KPI.
If you scheduled the right crew and estimated enough time, the percentage will be high.
Ideally, this percentage should be as close to 100% as possible.
Percentage of wrench time
Wrench time is the time your crews spend on actual maintenance activities. The formula is simple.
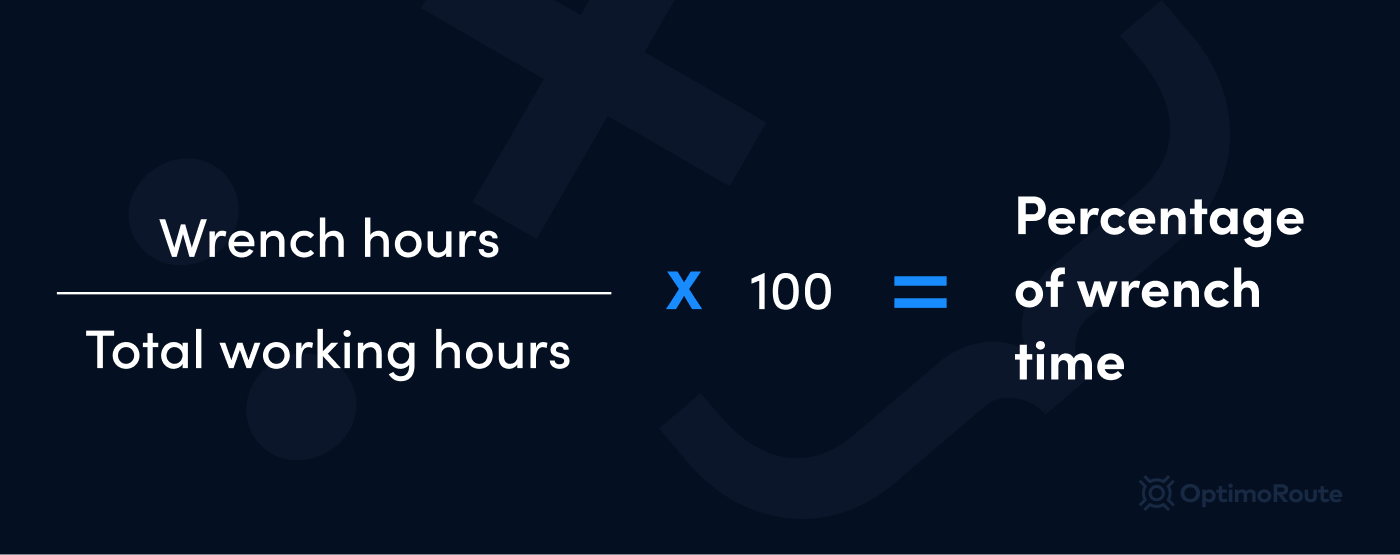
Benchmarks depend on the industry but can be as high as 60%.
That requires an incredibly efficient planning/management team and maintenance department.
Weekly planning/preparation time
The amount of time you spend on planning and scheduling work orders is an often overlooked metric for maintenance work.
If it takes your manager hours to figure out who to send where, at what time, that will drastically impact wrench time and other factors.
Mean time to repair (MTTR)
The mean time to repair, or MTTR, measures how long it takes your crews to fix an issue, on average.
The formula is simple:
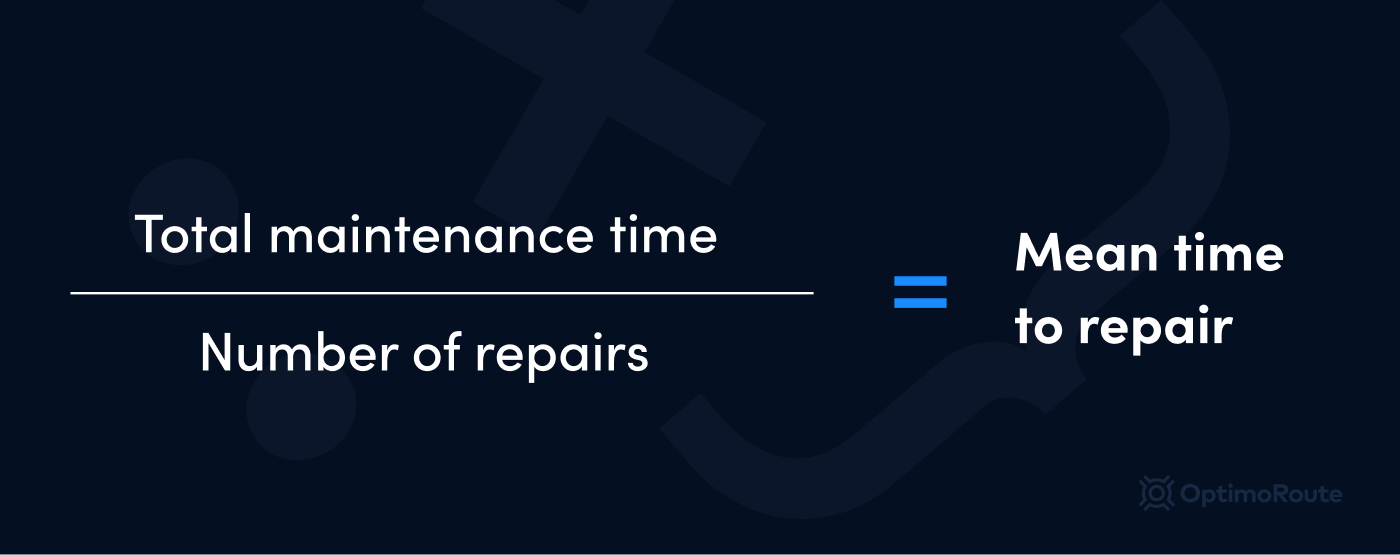
Taking internal benchmarks, then working responsibly to improve them should be the process here.
Unscheduled downtime
Hours of unscheduled downtime is one of the most reliable metrics for measuring the impact of a maintenance program.
It doesn’t just measure how often something breaks, but how long corrective maintenance takes to solve the issue.
You should work to get as close to zero hours as possible.
Mean time between failure (MTBF)
The mean time between failure shows the average length of uninterrupted uptime.
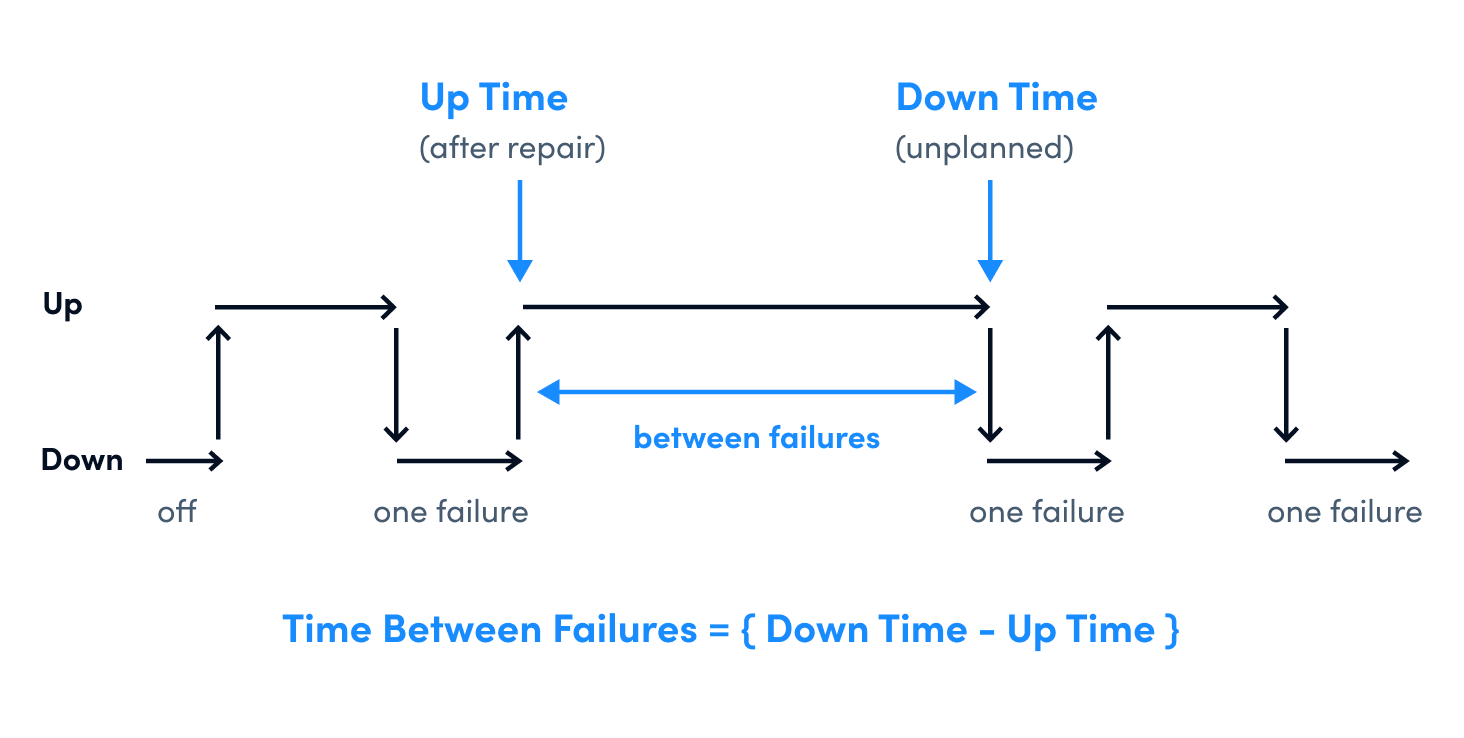
The formula is simple. Divide the total uptime (in hours) by the number of times the equipment failed in a time period.
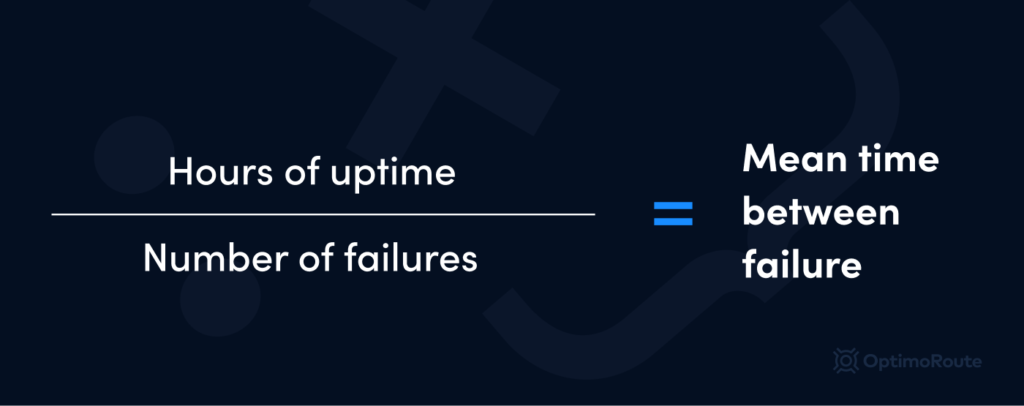
For example, if a factory runs 12 hours a day on weekdays, that’s around 3,100 hours per year. With 10 failures, the MTBF would be 310 hours.
Total maintenance cost
While you shouldn’t look at maintenance as only a cost center, you must track all maintenance costs.
If you also categorize the costs into unplanned and planned maintenance, you can find areas for improvement.
Ratio of budgeted vs actual maintenance costs
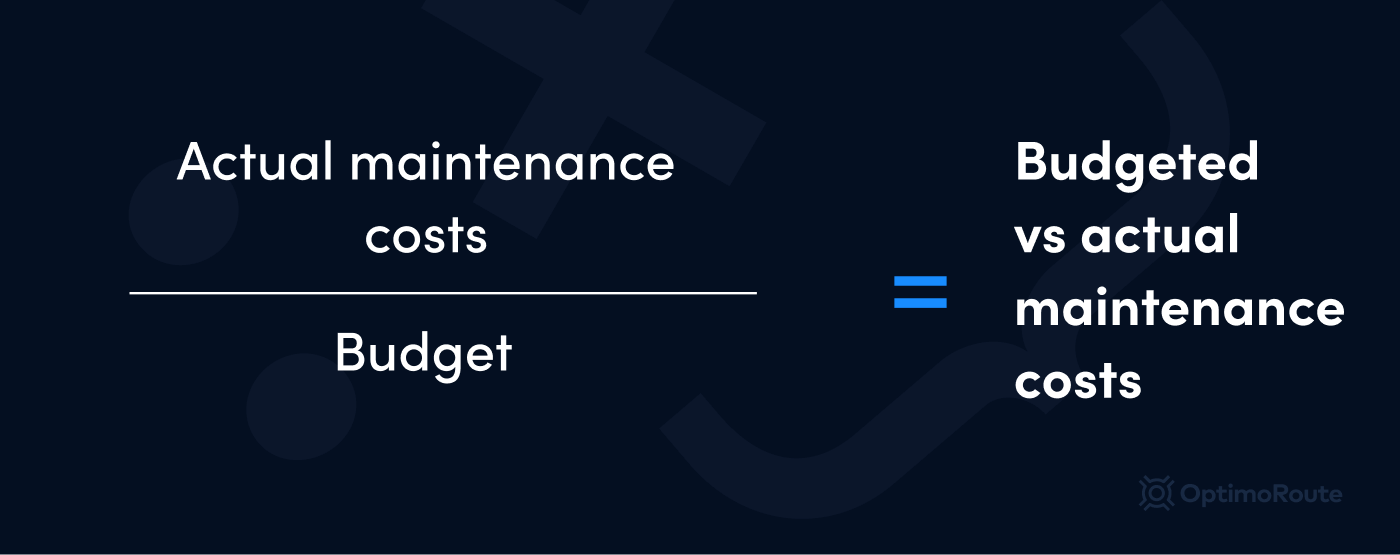
This KPI shows if your budget was accurate and if your maintenance program is efficient.
If they came from unexpected breakdowns and repairs, you may want to increase your focus on preventive maintenance.
If the unexpected costs came from a lack of efficiency in doing planned maintenance, that’s a problem.
Most important areas to focus on
The majority of companies focus on improving their planned work. Think KPIs like total work orders, the backlog, and what percentage get solved on the first try.
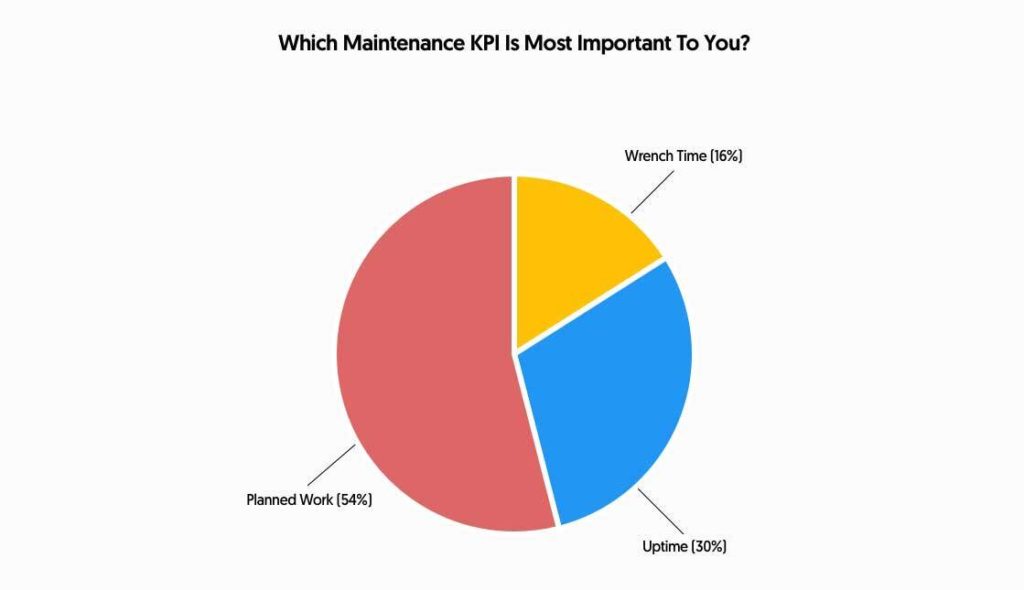
In a recent survey UpKeep found that 30% of companies focus on uptime and reducing breakdowns. They’ll measure downtime, MTTR, and MTBF. That should always be a focus for any company.
Finally, some companies value wrench time, or the actual hours that maintenance crews spend working on equipment.
But are these KPIs relevant for your company?
What Companies Should Focus on Maintenance KPIs?
Maintenance isn’t just something that affects manufacturing companies. Companies in almost every industry and of varying size rely on it to keep going.
Gas pipeline & electrical line companies
Gas pipeline and other similar companies rely on effective maintenance to avoid disasters and stay in business.
They can’t afford to rely on reactive maintenance. Imagine if a company just waited until a pipeline rusted and started leaking gas everywhere. The company would be finished.
Maintenance KPIs are crucial for companies where impeccable maintenance is a core business objective.
Field service (repair and maintenance) companies
Is your company’s whole business model selling maintenance to other companies? You can’t afford to “eyeball” how well you’re doing.
It’s essentially your entire customer experience. Maintenance metrics are a key indicator of your business performance.
Logistics, distribution, and delivery service companies
If your company relies on a fleet of vehicles, asset management and maintenance can have a huge impact on your bottom line.
Vehicle breakdowns and emergency repairs are expensive, sure. But the resulting delays and ruined merchandise can also cost you loyal customers.
Focus on your maintenance to avoid preventable issues.
Improve Your Planning to Handle More Work Orders & Improve KPIs
If you don’t have the budget to make new hires, you need to improve the efficiency of your existing crews. The easiest way to do this is to improve your planning and management of them. That’s where OptimoRoute comes in.
Speed up planning to improve wrench time and work through your backlog faster
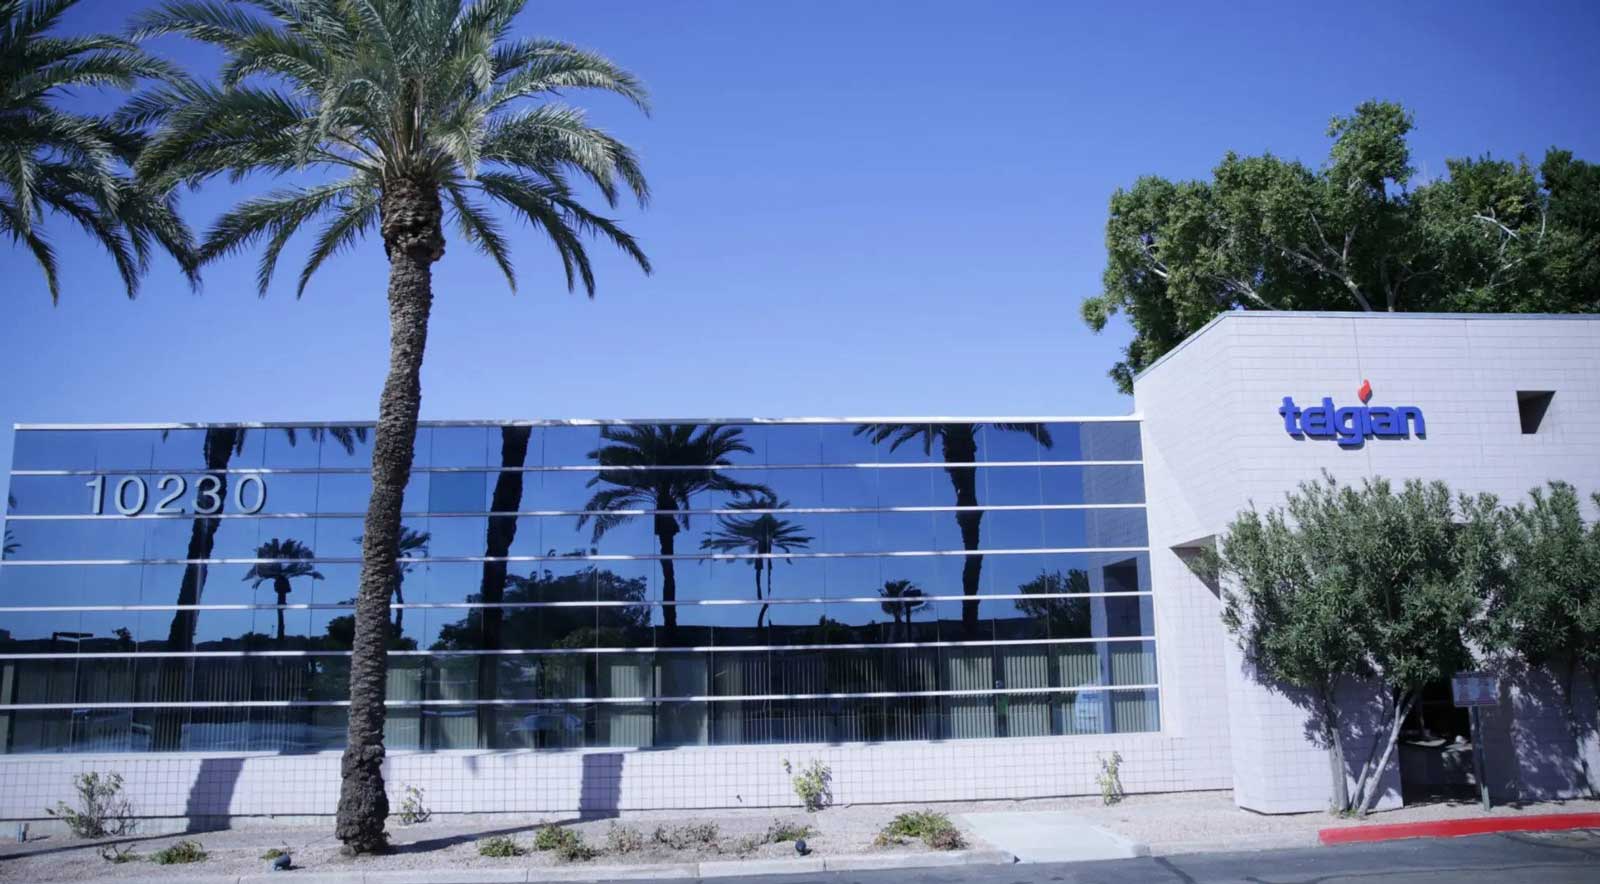
Telgian, a US leader in fire and life safety, used to spend over 18 days planning the next month’s inspections.
With different qualifications by state, hundreds of locations, and varying tool requirements for each job, planning work orders was a nightmare.
A team of three people had to work together, day and night, to get it done in time. It slowed down inspections and made it hard for the company to scale.
With OptimoRoute’s smart features, a single person can now handle the planning in under 8 workdays.
OptimoRoute accounts for qualifications, equipment, service areas, technician schedules, and more real-life variables when scheduling orders and creating routes.
In mere minutes, you can go from a work order list to a maintenance schedule with the ideal route for each technician.
The new system made it possible for Telgian to grow and scale and saved thousands of dollars per month in wages.
Match the right work order with the right technician to improve percentage of maintenance orders completed on first scheduling.
OptimoRoute doesn’t just speed up planning. It makes it more accurate as well.

With our software, Clarke Customer Care maintains a first-time fix rate of 80%. The vast majority of customers get their problem fixed in just one visit.
That’s a customer experience game-changer.
OptimoRoute accounts for variables like skill sets, tools, appointment, time windows, vehicle capacity, and more.
But that’s not all. Real-time tracking and dynamic replanning let managers adjust schedules on the fly to ensure techs meet all appointments. They quickly change 75% of all orders throughout the week, without any additional driving time.
Conclusion
It may seem like you need to invest in an expensive CMMS solution to track and put a dent in your maintenance KPIs, but that’s not the case.
Instead, you can use OptimoRoute to both schedule and distribute work orders and plan the routes for each assignment at the same time.
Start your 30-day free trial today and use OptimoRoute to boost your maintenance KPIs and results.
Try OptimoRoute™ for Free
No installation or credit card required