Business Benchmarks: Boost Your Bottom Line With These Insights

Without business benchmarks, you don’t have a compass to guide you.
You’re floating around a great big ocean, hoping the winds and currents push you to profitability.
If you don’t know where you stand compared to your competition, you have no north star. You don’t know if you should focus on marketing, charge more per client, double down on customer experience, or choose one between a hundred other decisions you need to make.
By getting familiar with the process of benchmarking your business, business owners can create a business roadmap to grow and scale confidently.
In this article we’ll show you how to use benchmarks to set goals and get a better understanding of your performance and business potential.
Let’s get started.
To navigate to the section which interests you the most, click below:
- What Is Benchmarking in Business?
- How to Find Industry Benchmark Metrics for Your Business
- 5 Essential Metrics to Benchmark Against Your Competition
- How to Improve Your Customer Satisfaction, Improve Your Efficiency, and Boost Your Bottom Line With OptimoRoute
- Beat Your Industry Benchmarks With OptimoRoute
What Is Benchmarking in Business?
Benchmarking is the process of comparing your business’ performance and operations against other businesses in your industry, market, or even location.
Strategic benchmarking can be a great way to find realistic short-term goals, set. a performance baseline, and figure out a competitive advantage you can use to win loyal, long-term customers.
What is an example of benchmarking in business?
A good example of benchmarking in action is an ecommerce store comparing bounce rates, conversion rates, and average order values against industry averages.
Benchmarking will help the company identify key performance indicators (KPIs) and understand which areas of its online experience it should focus on and improve.
Of course, benchmarking isn’t limited to digital or online businesses.
For example, a local pizza restaurant should benchmark their offering, prices, delivery times, and the number of customers against local competitors.
How to Find Industry Benchmark Metrics for Your Business
There are many different sources of statistics for finding industry data. For prices and number of customers, nothing beats actually scouting your local competition.
But for broader financial data, you can find everything you need online.
Typically, your national government will keep some sort of financial statistics based on company tax and financial reports.
US Census Bureau
If your small business is based in the US, your best source for competitive benchmarking is the US Census Bureau.
They have a number of industry-specific (as well as general) surveys with all the small business metrics you need to compare your company against the average.
The Annual Business Survey (ABS) includes data like sales revenue, employees, payroll, digital share of sales, and more.
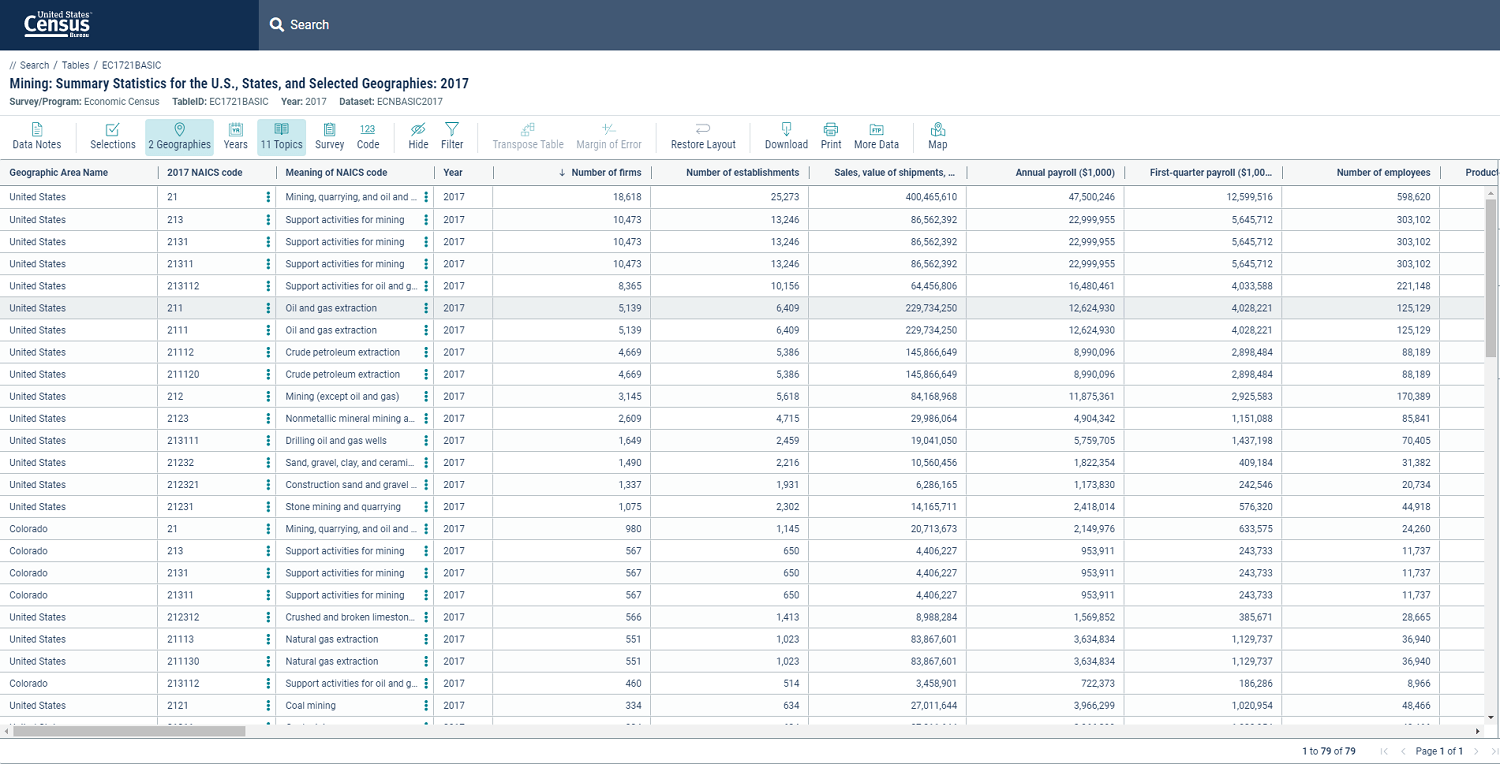
You can work with their online table tool or download the ABS data separately in Excel sheets. Put on your scuba gear and get ready to do a deep dive into the data.
You can also rely on third-party sources for this kind of information.
Third-party service company data & white papers
B2B SaaS and other service companies often have access to unique data points on how companies are performing during different time periods.
For example, OptimoRoute focused on analyzing delivery statistics during the initial post-shutdown period.
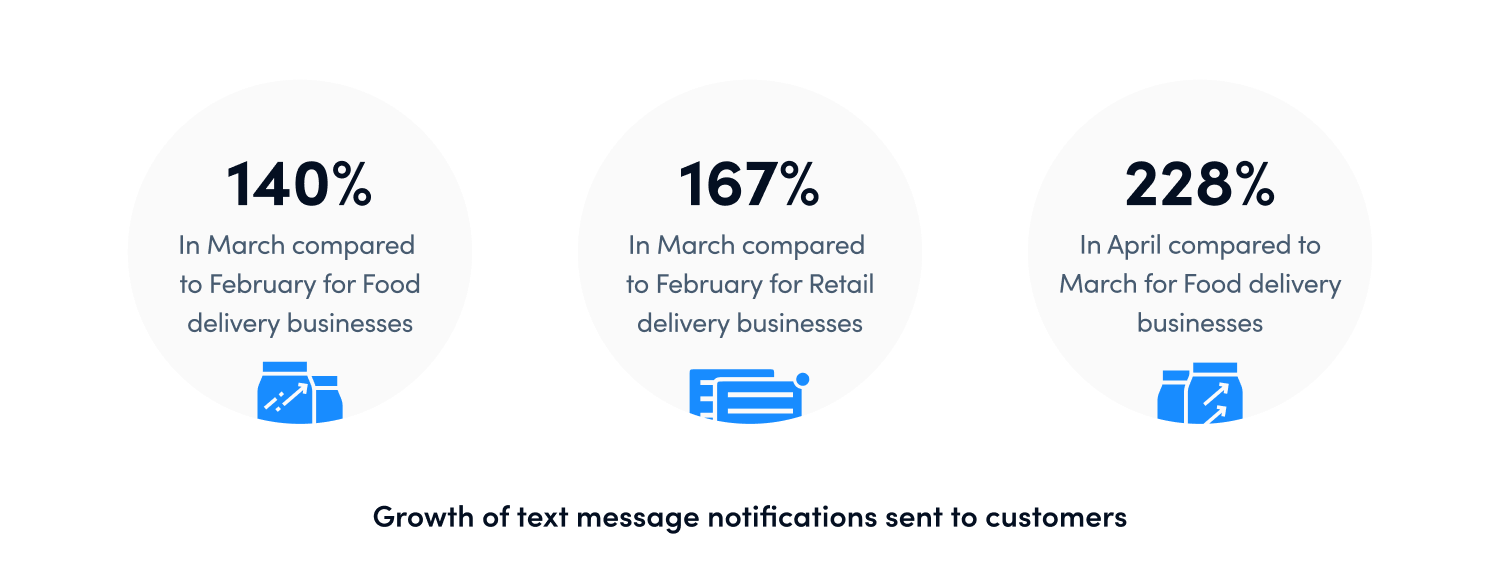
This enabled clients to use statistics and compare how their own increases in delivery demand stacked up against competitors.
To find other potential sources for information, explore the following organizations for white papers and internal data:
- Industry-specific SaaS (like a warehouse management system)
- Industry-specific consulting firms
- Financial SaaS (like invoicing or payment processing software)
- Massive accounting and consultancy firms like KPMG, McKinsey, Deloitte, and more
- Advertising platforms like Google or Facebook Ads
There might be other sources, but this really depends on your industry.
5 Essential Metrics to Benchmark Against Your Competition
For best results, focus on these essential performance metrics when benchmarking your company’s performance.
Sales revenue
Sales revenue is the most basic metric of business performance, and the easiest to benchmark.
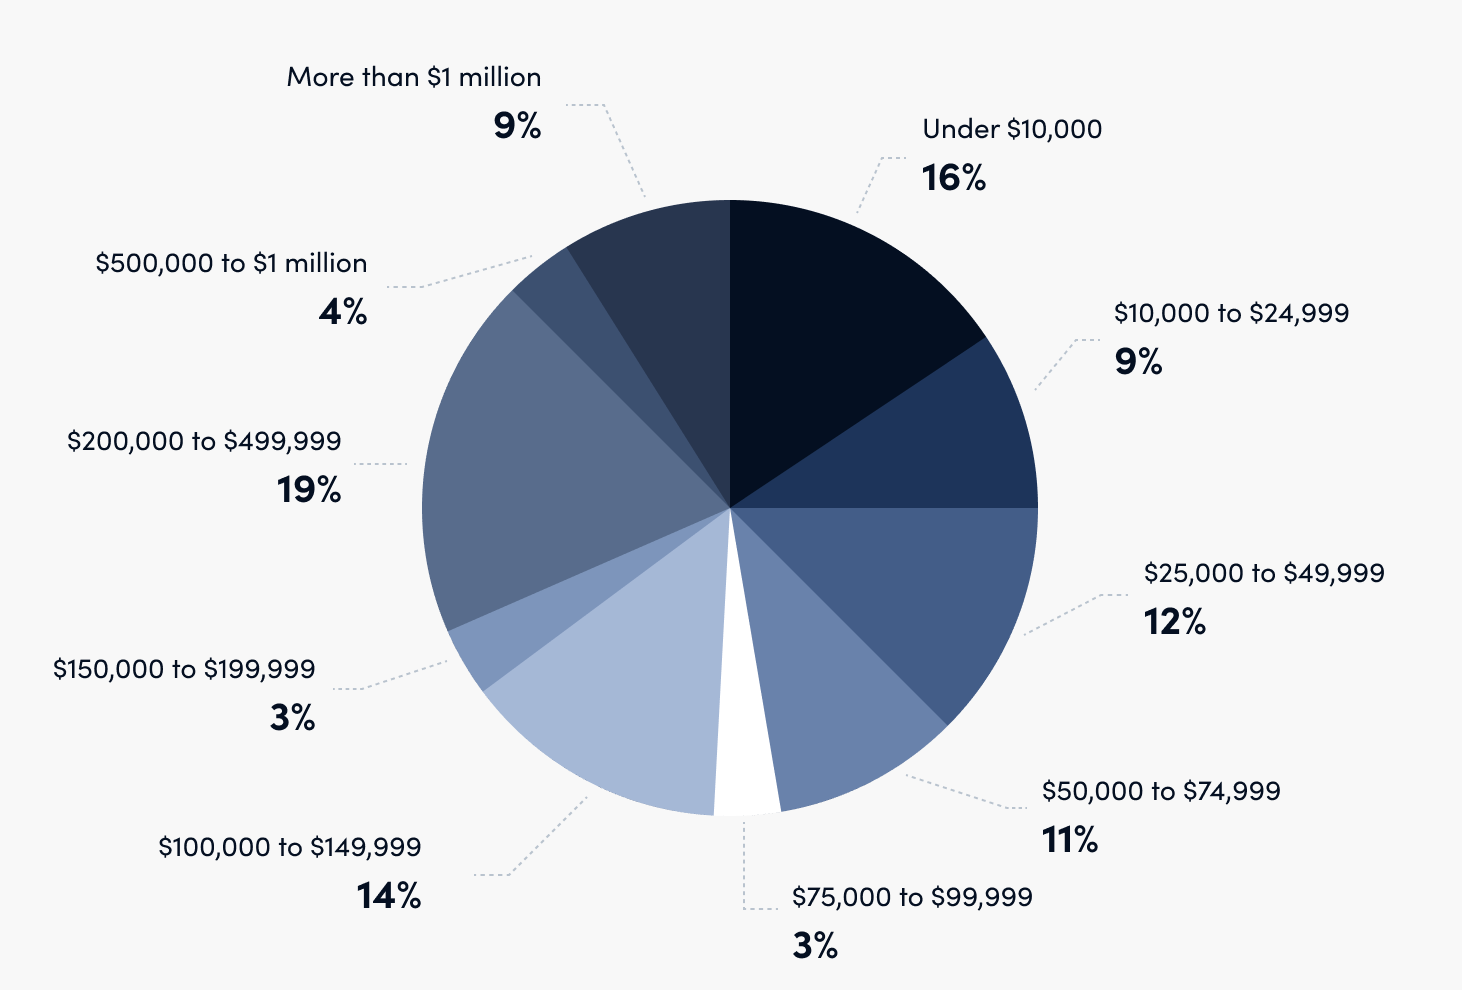
According to Business Knowhow, most SMBs have annual sales revenues of between and $10,000 and $150,000 (which is a heck of a difference):
If you want to compare your data with the Census data, just open the spreadsheet and find your industry.
For example, if you have a health store in Colorado, just filter the results based on the state and NAICS code or its meaning.
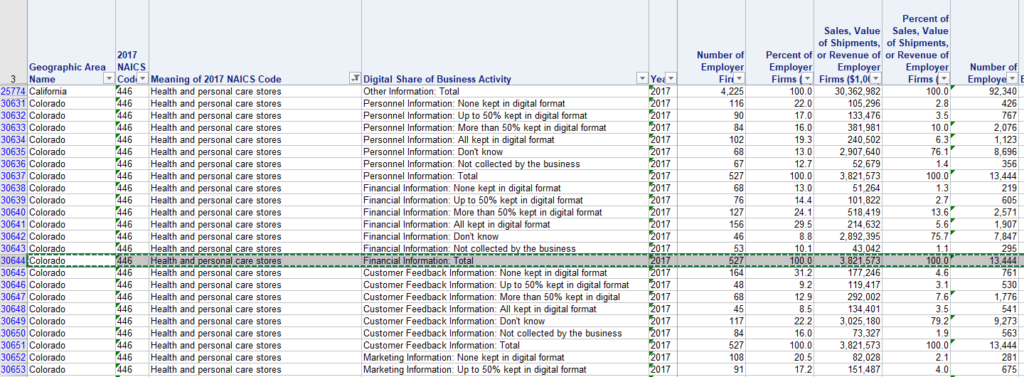
You can then copy the total data from the relevant row, and use it to calculate other meaningful metrics based on the sales revenue.
For example, the average revenue per employee in Colorado for similar businesses is $284,258.
Gross margin
Another essential metric to the benchmarking process is your gross margin. The gross margin is essentially what’s left of your sales revenue after subtracting basic expenses. For example, your cost of goods, payroll, and rent.
There’s actually a reliable third-party source for this, with many industries included and a sample of almost 4,000 different US companies.
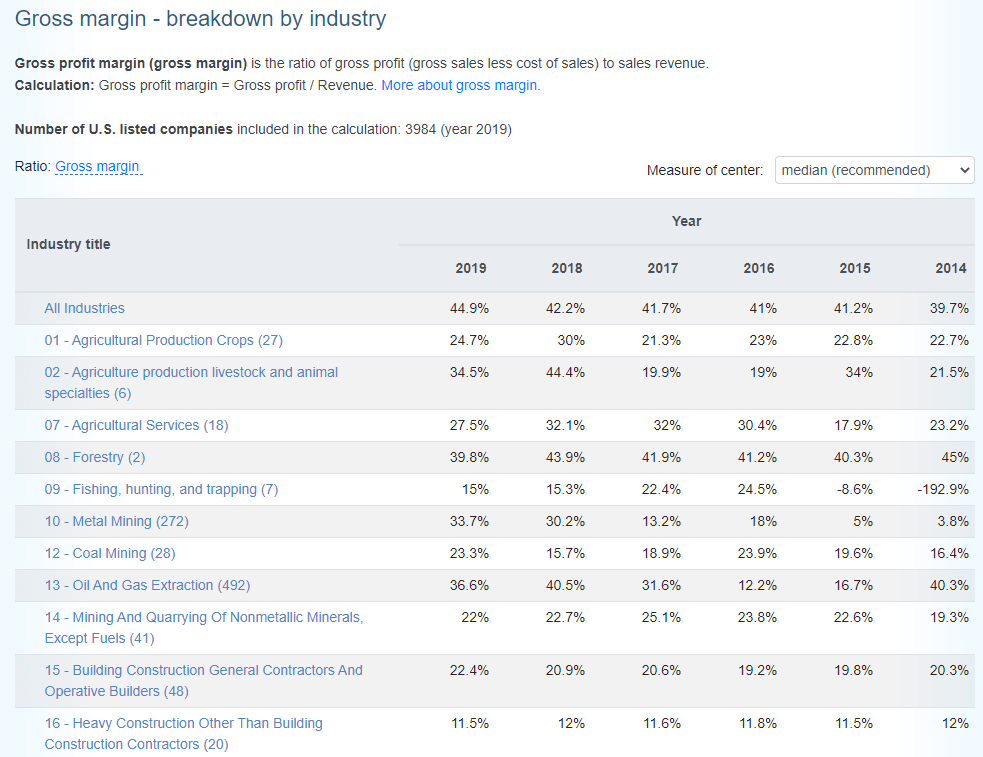
Of course, if you want numbers for your state or local area, you’ll need to play around with Census data some more.
Net profit margin
With different taxes and expenses unique to different industries, sometimes it’s not enough to know just the gross margin.
Only the net margin can show you if your business efficiency is a competitive advantage.
Because the census surveys don’t typically include tax numbers, calculating the final net profit can be difficult.
Thankfully, again, there are other sources you can use to benchmark your business against.
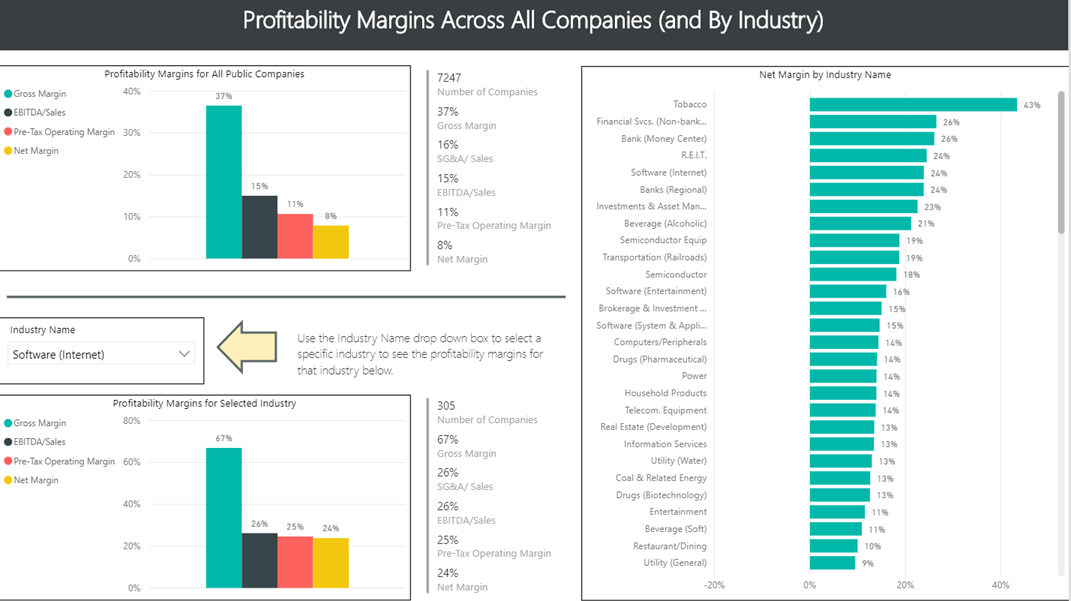
Compare your net profit margin against the industry average to find out if you need to improve efficiency or maybe even raise prices.
Customer satisfaction
Another area where it’s important to know where you stand is customer satisfaction. The American Customer Satisfaction Index releases up-to-date benchmarks every year.
The data for 2020 is already available.
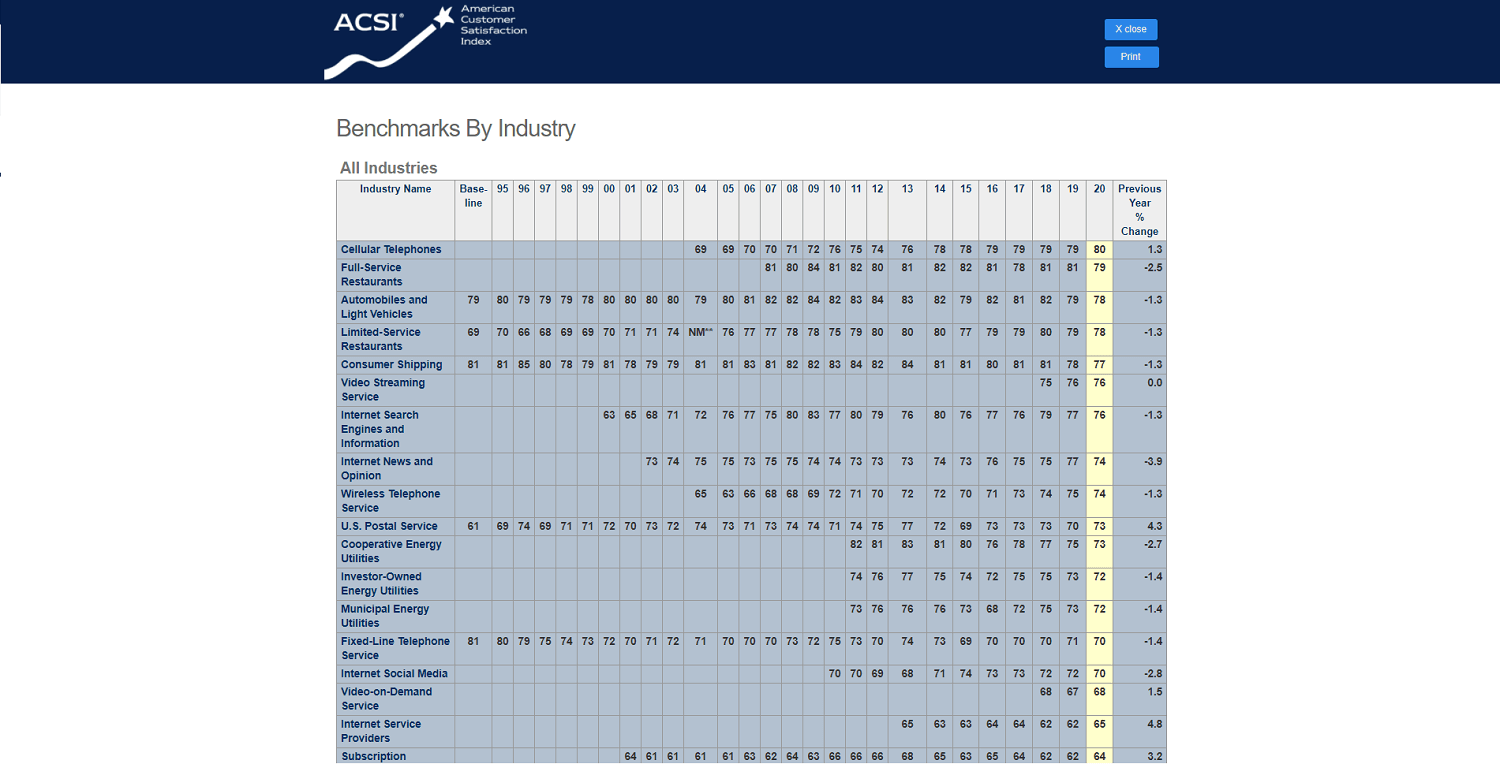
Focusing on customer experience is the best way to drive continuous improvement in your company.
For you to be able to compare yourself against these benchmarks, you need your own processes in place for surveying your customers.
Whether that’s automated surveys after each purchase, or you reach out to them on social media is up to you.

Shipping/delivery times
According to Kibo Commerce, 63% of ecommerce consumers expect “standard delivery” to arrive within four days, so offering better shipping options is one of the simplest ways you can increase online sales as a small business.
Of course, the expected delivery time depends on the industry. A florist is expected to deliver in a day, and a restaurant only has a few hours.
Both external and internal benchmarking is essential here, as it’s such a crucial part of customer experience.
But it can be hard to collect data if you manage the deliveries in-house. OptimoRoute gives you access to all kinds of benchmarking data, including how often you delivered on-time.
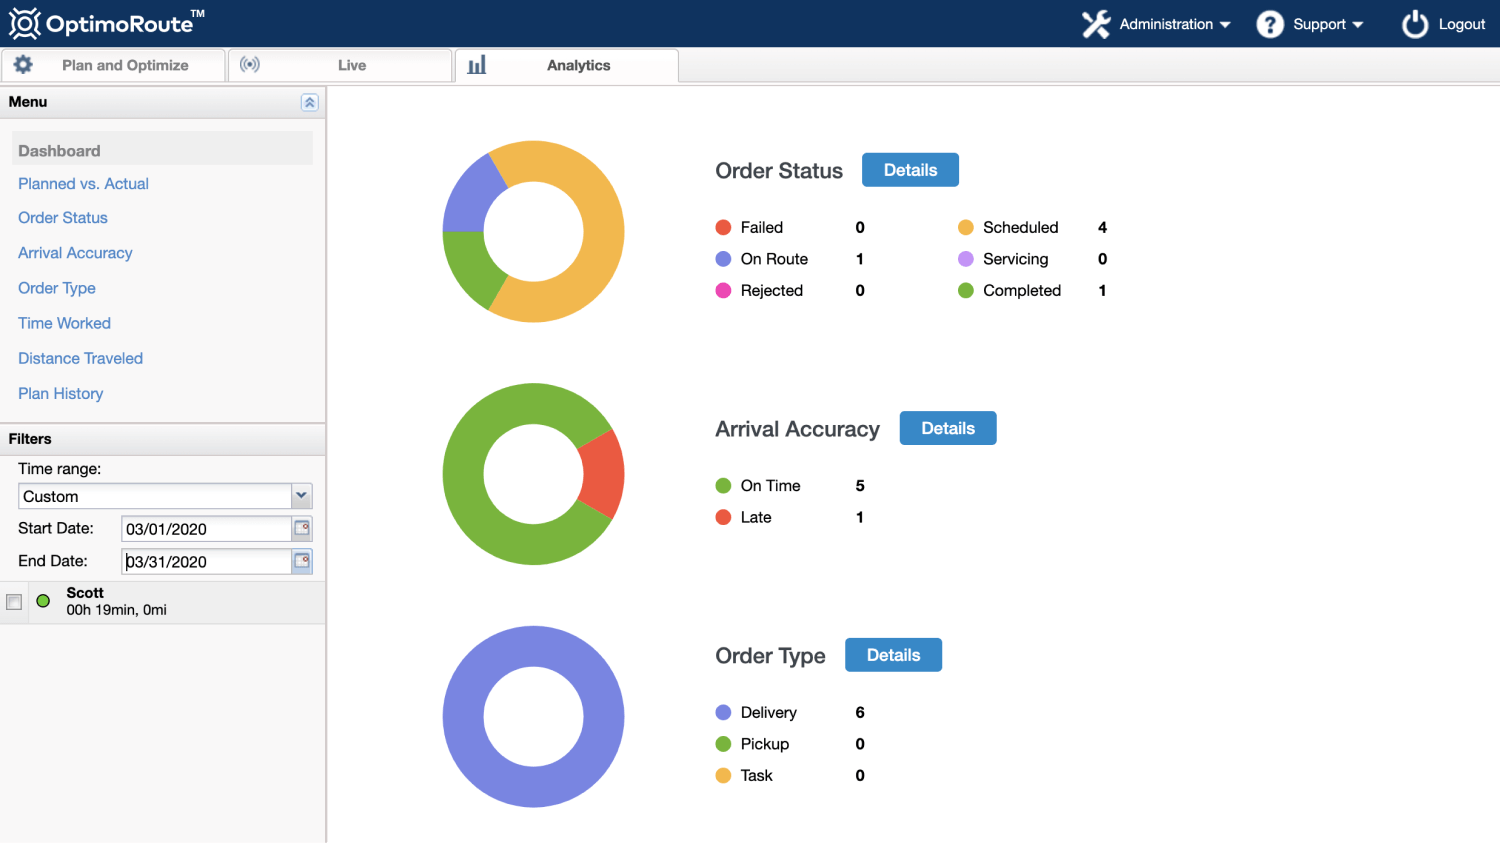
Of course, collecting and comparing your company to all of this data is just the first step.
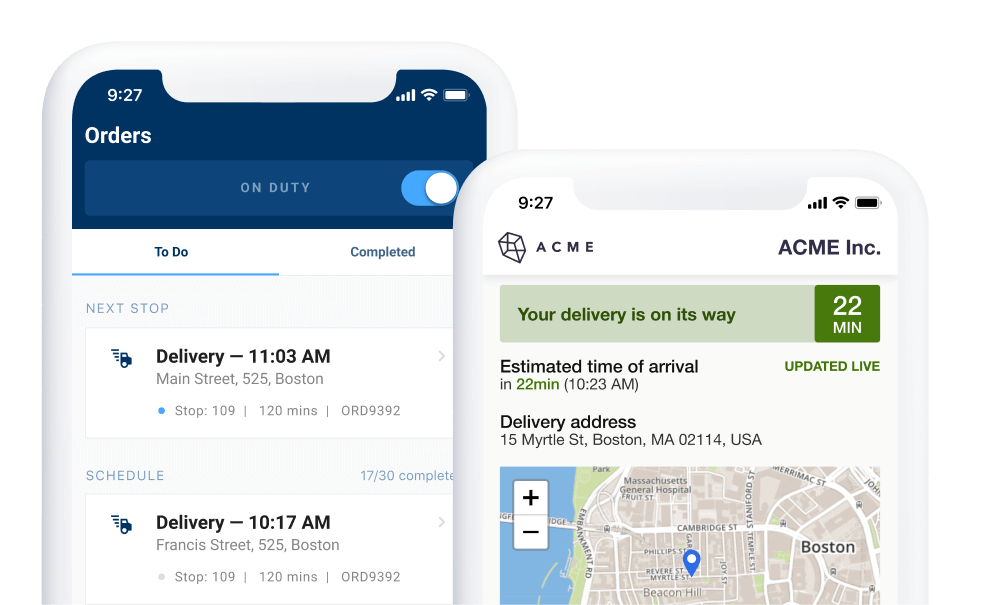
Reduce your operational costs by 30%
Increase delivery capacity by 43%
Plan 7x faster
How to Improve Your Customer Satisfaction, Improve Your Efficiency, and Boost Your Bottom Line With Optimoroute
A benchmarking study is a good place to start, but in itself, it won’t improve your business results.
OptimoRoute doesn’t just optimize your delivery routes and supply chain. It can help you optimize your business processes across the board.
Handle more customers with your existing workforce, drive more revenue, and save money and time by reducing failed deliveries and missed appointments.
But don’t take our word for it. Let’s take a closer look at a real example.

Get more jobs done (without hiring more staff) with more efficient scheduling and routing

By using OptimoRoute’s long-term planning (up to five weeks), Clarke was able to forecast availability much better. This allowed them to accept more last-minute jobs, and handle 10-15% more service calls on any given day.
Get happier customers by always fixing their issue on the first try
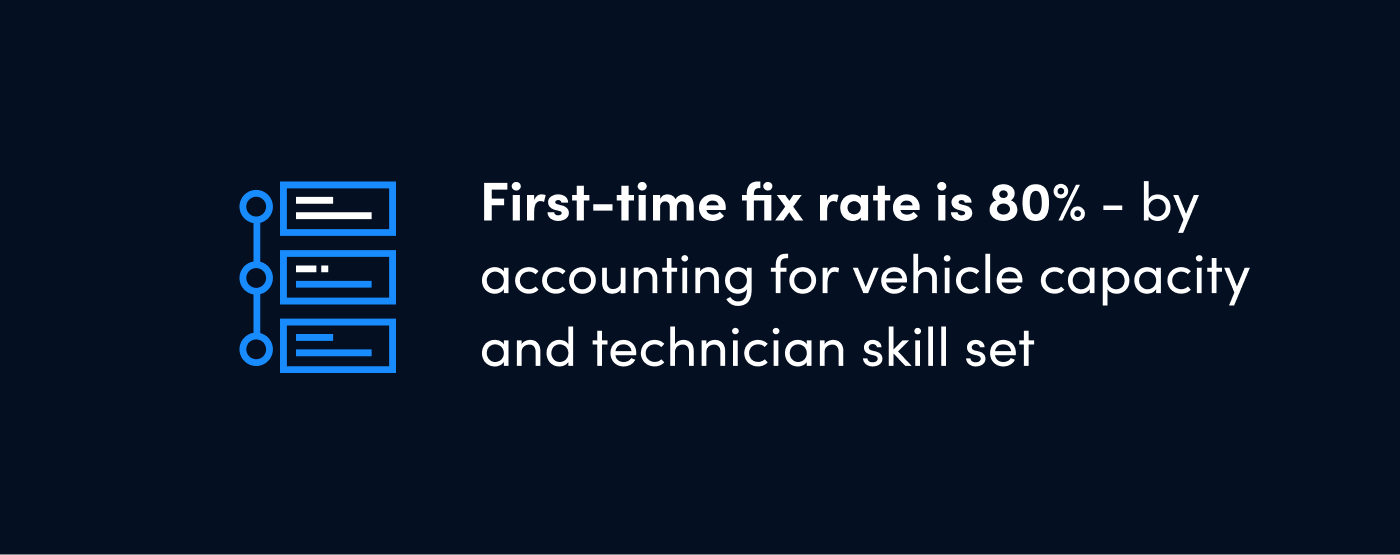
Before OptimoRoute, dispatchers would spend hours matching the right technician and loadout with each customer. Our software lets them set skill sets and qualifications at the driver level, automatically matching drivers with appropriate orders, leading to a first-time fix rate of 80%.
Avoid missed appointments and save time and employee costs with automated notifications
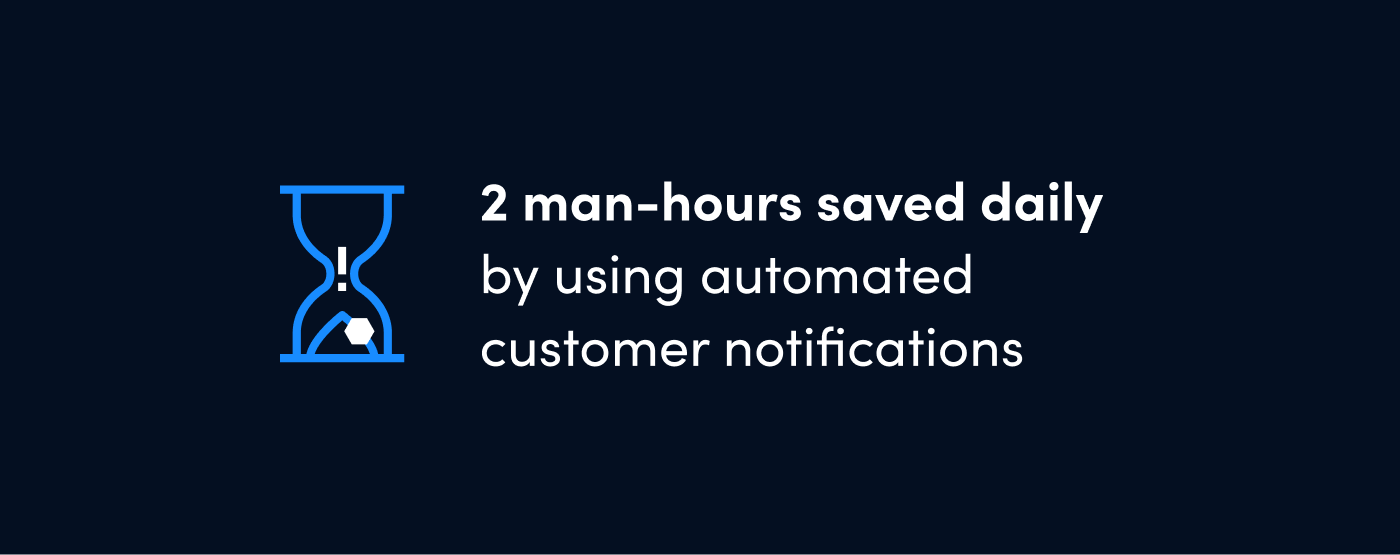
Nobody wants to manually call customers and remind them that a technician is on their way. The worst part is, the customers don’t want to receive those calls either.
OptimoRoute’s real-time tracking and automated SMS notifications saved Clarke 40+ hours of manager workload per month. That’s a full work week.
Use dynamic replanning to accommodate your customers without messing up schedules
OptimoRoute’s dynamic replanning feature lets you quickly add new (or remove old) orders in real time.

The dispatcher or manager can then send these changes directly to the driver’s mobile app.
This workflow allows Clarke to adapt over 75% of its planned service calls. Making sure the customer gets what they want, without disrupting the workflow of any technician.
Beat Your Industry Benchmarks With Optimoroute
With OptimoRoute, you can boost your efficiency and increase your sales revenue without increasing your workforce.
By focusing on faster and more consistent delivery or service calls, you can also get happier, more loyal customers.
Improving your fundamental process for scheduling and routing can impact every area of your business, not just your delivery times.
Beat your industry benchmarks with OptimoRoute, start your 30-day free trial today.
Try OptimoRoute™ for Free
No installation or credit card required


