13 Most Important Small Business Metrics to Track

According to the latest US Bureau of Labor Statistics data, around 1 in 5 of new businesses fail within a year, and half fail within 5.
As a result, if you want your company to scale successfully, you need to control and optimize every part of your entire operations. The best way to do this is to monitor and improve essential business metrics.
Here are 13 crucial small business metrics you can leverage to analyze business performance, drive more revenue, and improve customer relationships. We also created several handy automated calculators for you to quickly calculate several key metrics.
To navigate to the section which interests you the most, click below:
- What Are Key Metrics for Small Business?
- 5 Essential Small Business Metrics for Marketing and Sales
- 5 Essential Customer Service and Experience Metrics for Small Businesses
- 3 Essential Operational Metrics
- Improve the Customer Experience and Your Operational Efficiency With OptimoRoute
What Are Key Metrics for Small Business?
The most important metrics for small businesses and startups are sales, operational, and customer service metrics. Each key metric has smaller metrics that define its success depending on the nature of your company as a whole and what your business goals are. Let’s break these down:
Sales and marketing:
- Sales revenue
- Net profit
- Sales growth
- Average monthly leads
- Average lead conversion rate
Customer service and customer relationship:
- Customer lifetime value
- Customer retention rate
- Customer satisfaction (NPS or CSAT)
- On-time delivery rates
- Shipping accuracy
Operational metrics
- Payroll
- Overtime cost
- Vehicle and driver utilization
The difference between SMB and enterprise KPIs
The main difference between a small business and enterprise KPIs (Key performance indicators) is how enterprises often focus on the whole supply chain.
For smaller scale businesses, you typically get a better ROI (Return on investment) from focusing on your customers and internal processes.
Sales and marketing team KPIs like CAC (Customer acquisition cost) and customer lifetime value stay the same, although many small businesses don’t measure them effectively.
5 Essential Small Business Metrics for Marketing and Sales
Of course, increasing the amount of money coming into the business is one way to improve your SMB’s chance of surviving. These metrics will help you gauge the performance of marketing campaigns and your sales team.
Sales revenue
Sales revenue is the total amount of money acquired from product or service sales over any given time period. There’s no complex formula required, you just need to tally up the overall sales.
If you want to progress as a business, track monthly, quarterly, and yearly sales revenue closely.
Net profit
Net profit also known as net income or net earnings is in reality something we hear spoken quite often in conversation. The most common term for it is – the bottom line. It refers to the amount of money left over after you have subtracted various expenses from your total revenue. These include interest, operating expenses, taxes and more. The basic formula is actually quite simple.
You can also use the following calculator:
However, calculating net profit can sometimes get a little tricky as it is essentially the money that’s left after payroll, cost of goods, and other expenses.
For instance, if you buy products or goods in bulk and sell them over time, you need to calculate costs on a product basis and tally the expenses for all the products you sold in any given period.
With gross profit, all you need to remove is the cost of goods. With net profit, you also include the total payroll, rent, various expenses, and finally, taxes.
You can also use the following calculator:
Because there are a lot of factors, it’s often easier to use dedicated accounting software like to calculate it for you.
Knowing your net profit lets you know how much leeway you have to reinvest in your business. If your net profit is low, it can be a sign that you need to improve your business processes or raise your prices to improve profitability.
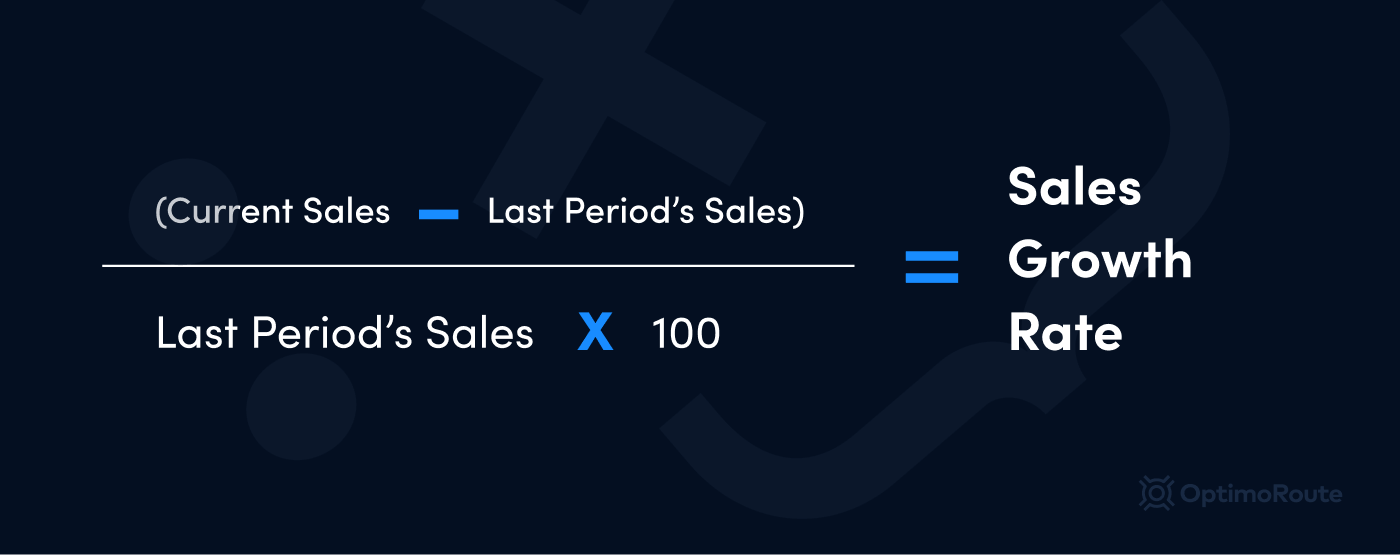
Sales growth rate
The sales growth rate is an essential sales and marketing metric that measures progress in total number of sales from month to month or year to year.
The formula is simple, deduct the last period’s sales from total sales, and divide it by the last number.
Your sales growth rate is one of the most important business data points that you have. It’s a signal that shows if any changes you made to your business are working or not.
For example, when you change your marketing or sales strategy, branding, release a new product, or make new hires, pay attention to your sales growth rate.
Average monthly leads
By familiarizing yourself with the average number of leads, your sales team can easily spot an outlier month (good or bad) when it comes along.
This allows you to adjust your marketing efforts in real time. If you have a lower than average number of leads, experiment with new marketing platforms and campaigns. When it comes to digital marketing, focusing on SEO and measuring metrics like website traffic, bounce rate, and click-through rate can help you generate leads from your website.
To calculate average monthly leads, you choose a period of the year with a relatively stable demand, and use that to calculate the performance metrics.
You can also use the following calculator:
Lead conversion rate
There’s nothing better than being able to predict the number of customers your business will have. It’s easier than you think. For example, if your sales team talks to 50 businesses, what number of those businesses will most likely convert?
To calculate that, you must first work out what the lead conversion rate is in your sales funnel. The formula is quite simple. You divide the total number of conversions by the number of leads and then multiply by 100.
You can also use the following calculator:
A bad conversion rate is typically a sign of either a bad sales team, or poor quality leads. Evaluate the quality of your leads to see if you need to adjust your marketing strategy or improve your sales process.
To find other essential financial metrics for your industry, read our guide to business benchmarking.
5 Essential Customer Service and Experience Metrics for Small Businesses
Every business wants to have return customers, so you need to make sure that you’re treating them right. According to Microsoft, 95% of their consumers stated that great customer service is a key factor in their choice of brand.
Customer lifetime value (LTV)
The lifetime value of a customer, represents the total amount of money a customer is expected to spend in your business, or on your products, during their lifetime. Knowing this figure to know helps you make decisions about how much money to invest in your marketing efforts.
In other words, do you focus on acquiring new customers or retaining existing ones.
Here’s how you calculate your customers LTV:
LTV = (average purchase value) x (number of purchases in 12 months) x average length of the customer and business relationship (in years)
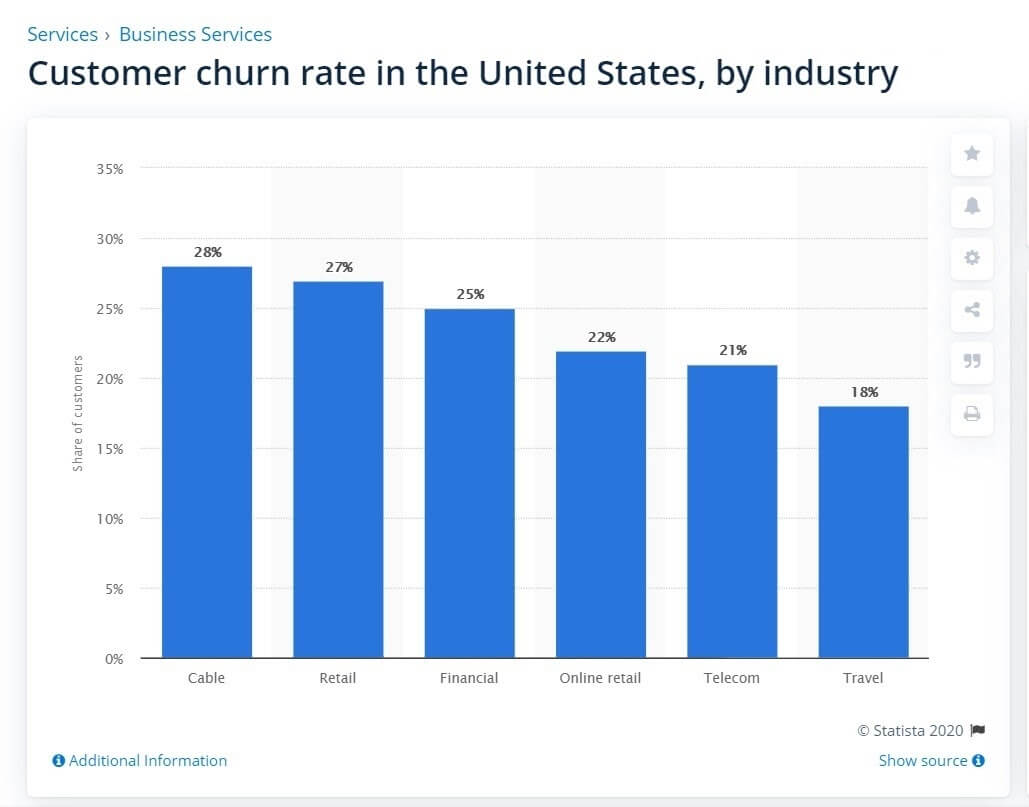
Customer churn rate and customer retention rate
Your annual churn rate is the percentage of customers that leave each year, monthly rates go by month. Average churn rates vary based on industry, but often go as high as 25% or more per year. To calculate your churn rate, you divide churned customers over a period of time by the number of customers you had at the start of that period.
For recurring services, your churn rate is the most important signal you have about your customer experience. If it’s higher than your industry average, you know you need to work on how you nurture your customer relationships.
Here’s how to calculate your businesses churn rate:
(Customers at start – customers at end) / customers at start = monthly customer churn rate
The customer retention rate is the inverse, simply calculating the percentage of customers that stay from period to period.
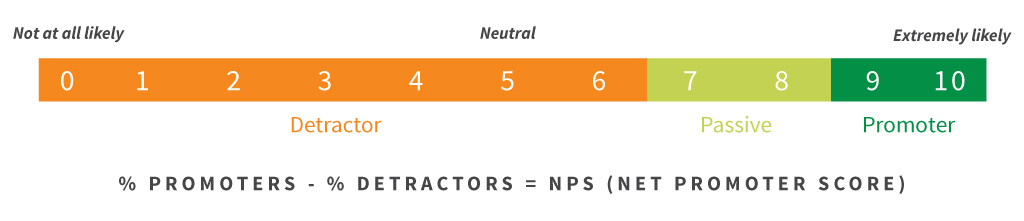
Customer satisfaction (NPS or CSAT)
There are also more direct ways of measuring customer satisfaction rather than inferring based on revenue.
You can ask your customers through surveys.
The Net Promoter Score (NPS) is a one-question survey that asks customers how likely they are to recommend your product or service.
The customer satisfaction (CSAT) score is measured by another simple survey that asks customers to rate their satisfaction with a product or service.
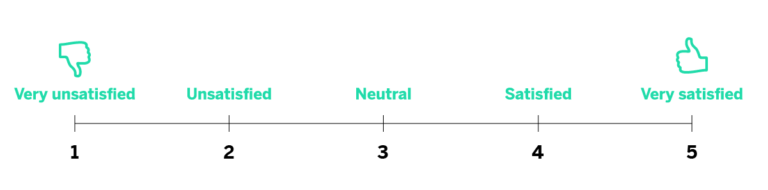
Calculate CSAT by dividing the number of 4 and 5 answers by the total number of answers.
Compare your CSAT scores to your industry average. If you don’t stack up, it’s time to double down on customer experience.
On-time delivery rates
Delivering on time is crucial to attract and keep new customers. According to Capgemini, 45% of consumers won’t recommend a brand to their friends after receiving a delayed package.
Thus keeping an eye on the percentage of deliveries completed on time makes the difference between a business succeeding or failing.
You can also use the following calculator:
However, this formula will only give you a rough idea and a percentage overview. In reality what you might be better off with is a more detailed overview into your delivery analytics including driver specific metrics, total number of miles travelled and more. OptimoRoute analytics gives you access to these metrics and other essential data on your delivery performance.
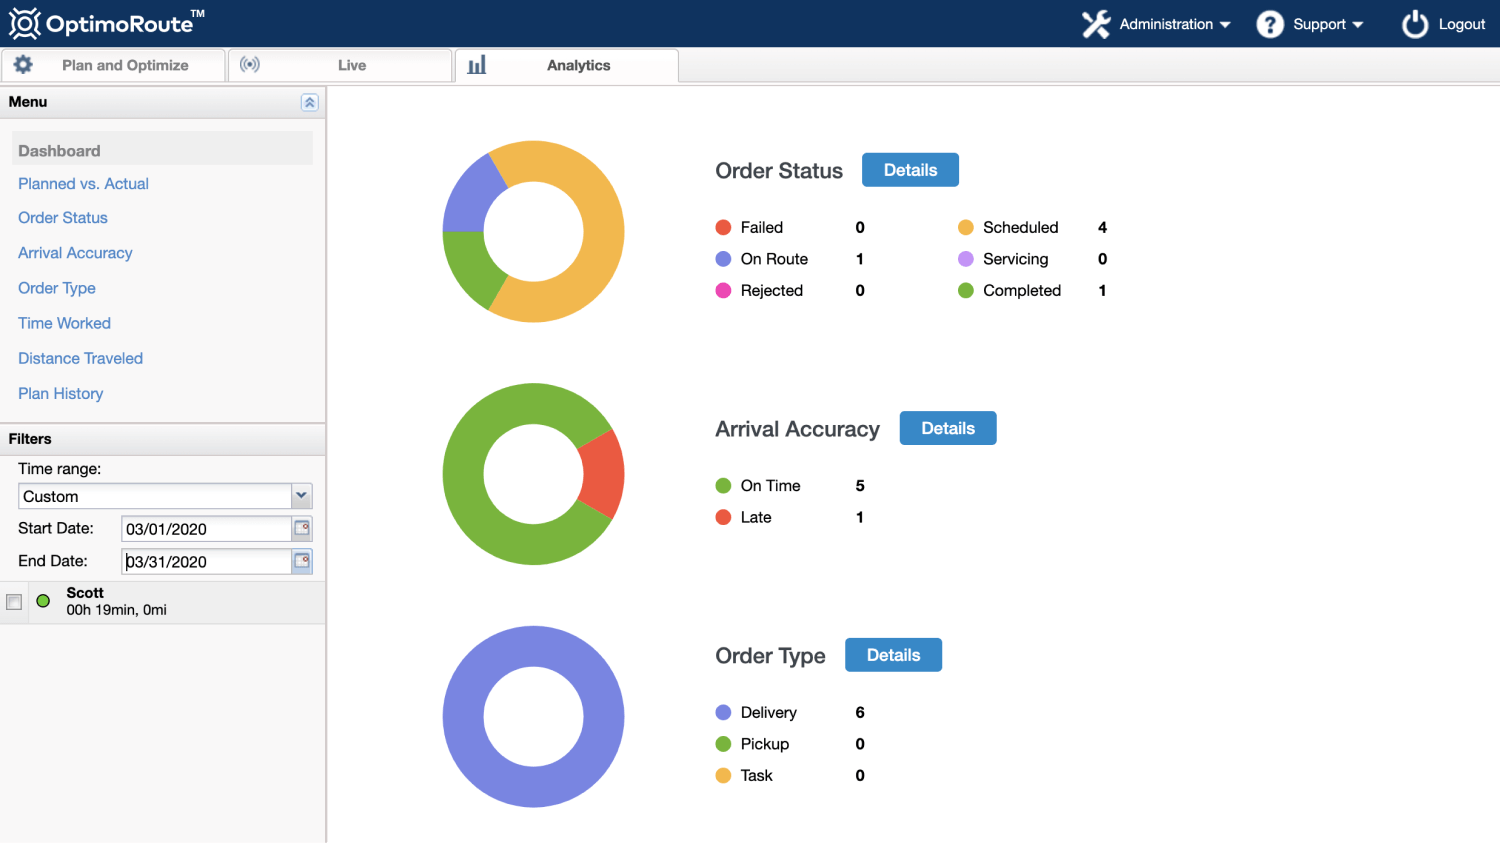
If a significant number of your deliveries aren’t delivered on time, that is an area of customer experience you must improve. To get loyal customers, the very basic first step is to actually deliver packages on time.
Shipping accuracy
Calculating your shipping accuracy is essentially the same as working out you on-time delivery rates. The formula is simple:
(Total number of deliveries – failed deliveries) x 100 / Total number of deliveries
But to run a successful business, you need to work out more than just the formula.
After all, what makes your customers less happy than a delayed package? A package that ends up in the wrong place! That’s a great way to end up on social media (in a bad way).
Use a service like OptimoRoute to minimize the number of manual steps, like looking up an address. Include features like Realtime Order Tracking and Customer notifications to keep your customers happy and informed.
You want your shipping accuracy as close to 100% as possible.
With the OptimoRoute driver app, the driver just needs to click a button and it opens their map software with the right address. This helps reduce human errors and improves shipping accuracy.
3 Essential Operational Metrics for Small Business
According to PWC, 77% of CEOs said their main focus is to drive increased revenue through improved operational efficiency.
Tracking basic operational metrics as an SMB can help you improve your productivity, profit margins, and even give you unique competitive advantages.
Payroll and cost of goods
Payroll is just the overall cost of hiring every employee, and the cost of goods (also called cost of goods sold, or COGS )is the cost to deliver a single product or service.
Business owners must track these basic expenses at all times to keep track of their cash flow and bottom line.
Overtime cost
If you run an inefficient operation, this can often lead to unnecessary overtime costs. Staying on top of it can help you see where your company needs to improve.
Using OptimoRoute, you can determine if you want to include overtime for your drivers or re-route your deliveries to another day allowing you to save substantially.
Vehicle and driver utilization
For a small business with delivery as a key component, utilization of drivers and vehicles is a crucial metric. But it’s almost impossible to track and calculate manually.
OptimoRoute makes it easy by automatically calculating utilization rates and giving you powerful scheduling and dispatch management tools to address underlying issues.
Improve the Customer Experience and Your Operational Efficiency With OptimoRoute
It’s no secret to small business owners that travel time doesn’t contribute to sales and revenue.
OptimoRoute reduced the time drivers spend on the road with smarter routes. With smart scheduling and routing software like OptimoRoute, you can ensure that your customers get their packages or technicians on time, when they need and expect them.
This will improve your reputation, word of mouth marketing, and customer retention. Plus, you will have the operational foundation to scale and grow your business and revenue.
Optimize and grow your small business with OptimoRoute, start your 30-day free trial today.
Try OptimoRoute™ for Free
No installation or credit card required