OptimoRoute’s Data-Driven Logistics: The Analytics Dashboard
In today’s fast-paced world, efficient route optimization and operations management are crucial for businesses in various industries. Whether you’re a small local delivery/field service business or a large-scale one, making the most of your resources and minimizing operational costs is essential. That’s where OptimoRoute’s Analytics Dashboard comes into play with its powerful ability to provide a snapshot of your business to:
- Analyze past performance
- Helps you improve your business processes
- Reduce future costs
- Gain insights into various aspects of your business
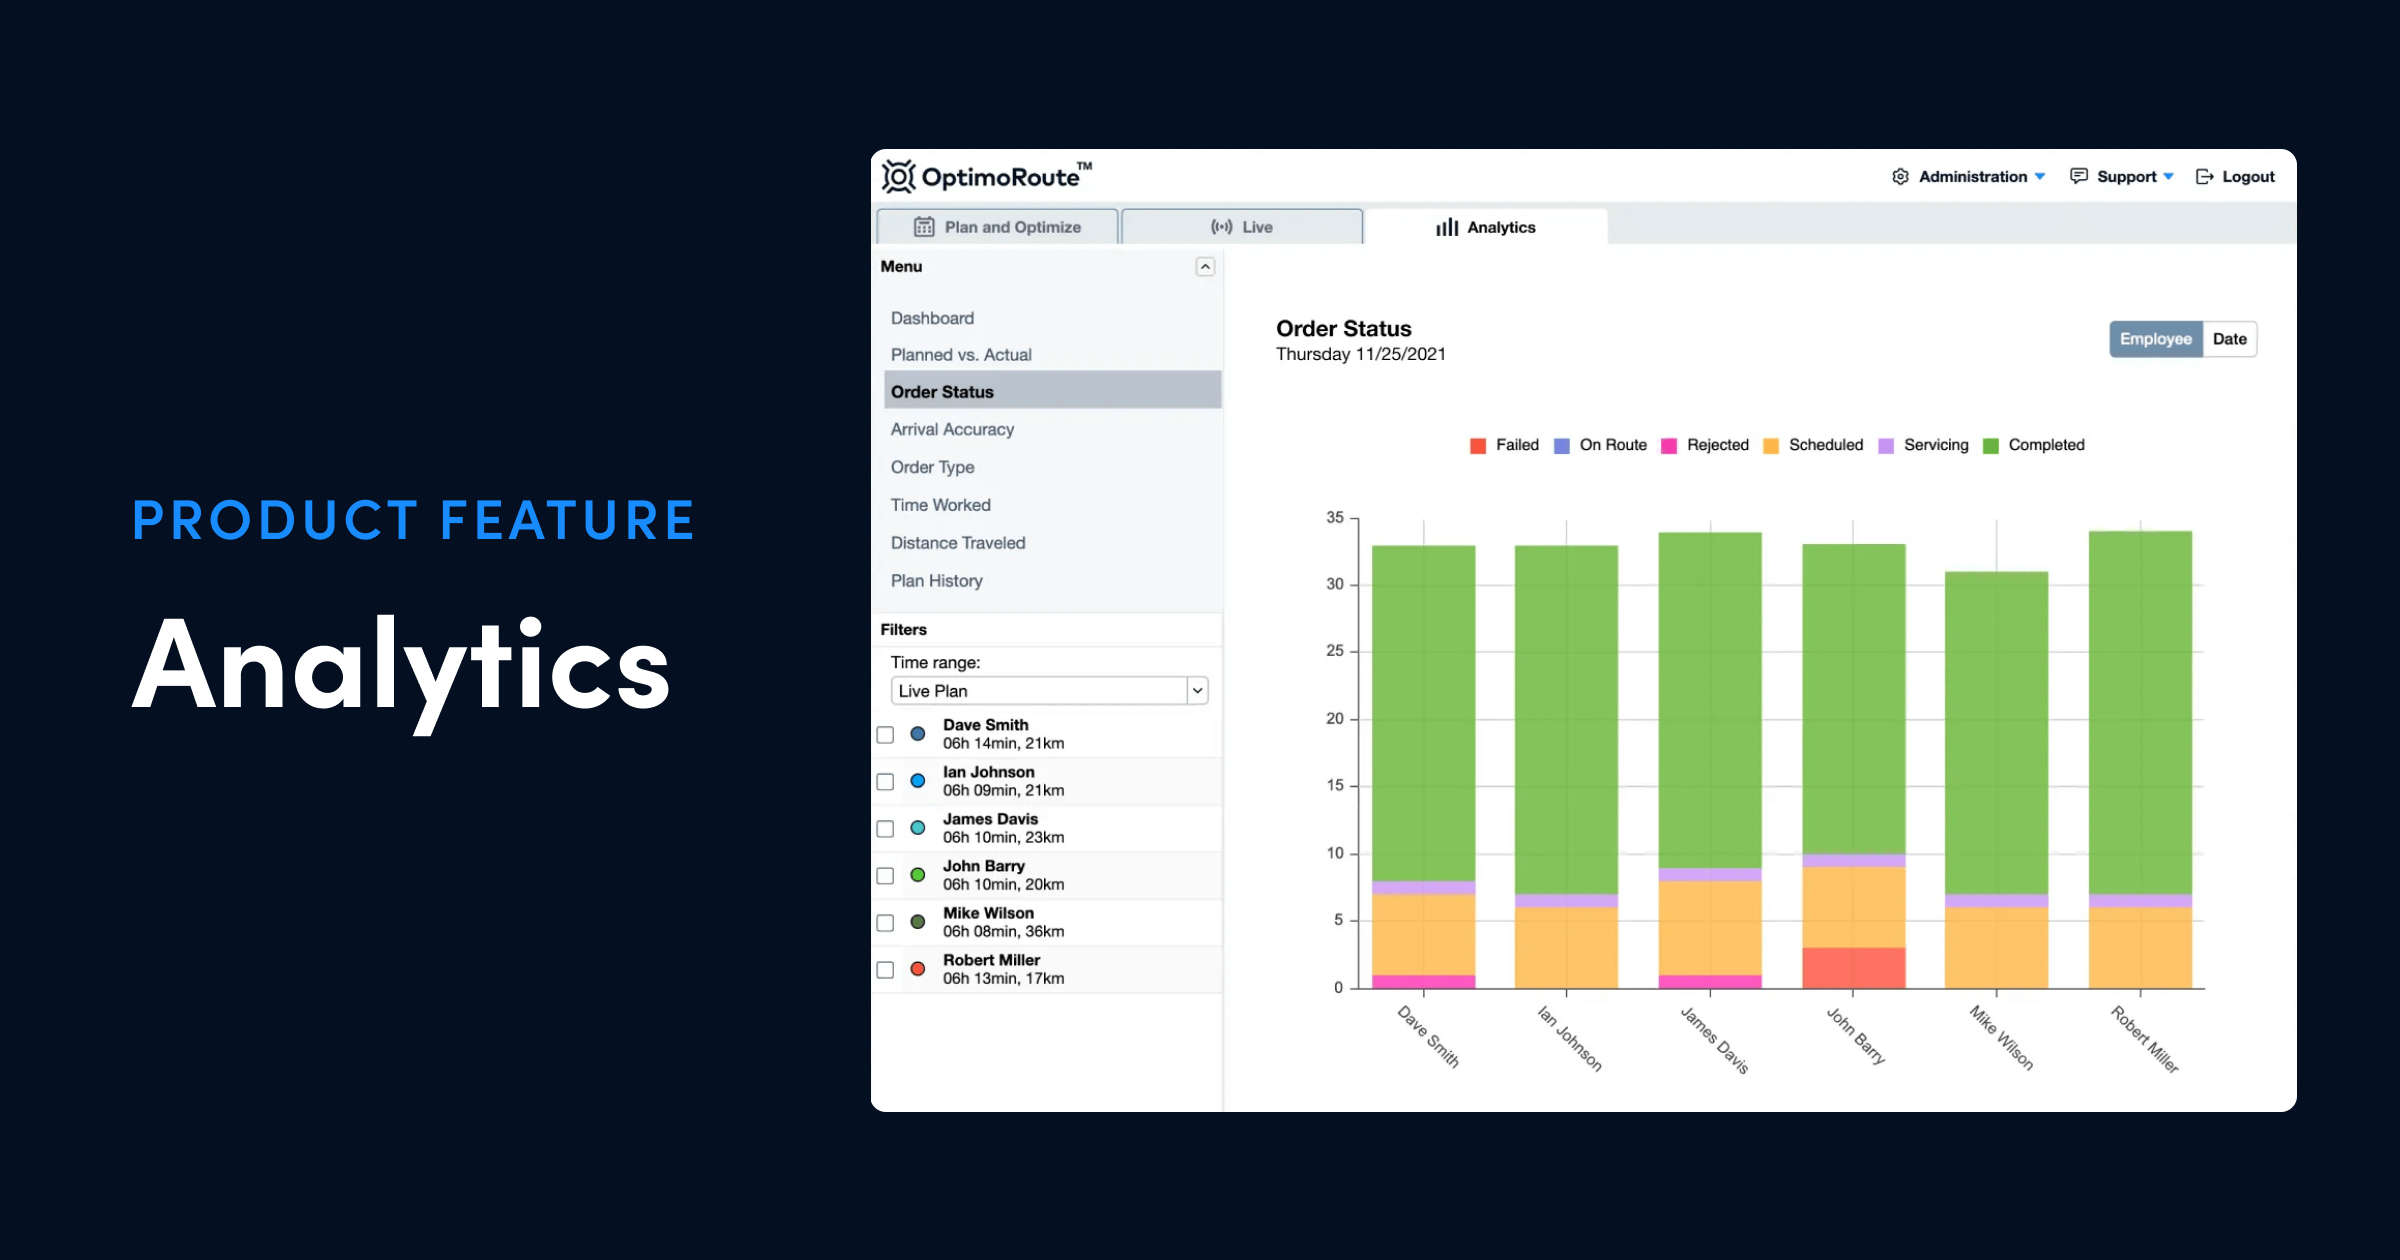
Data Visualization
Visualize your order or task data in a variety of ways to capture unique business insights. This visual representation of all your historical data can help identify patterns, trends, and areas for improvement. For example, if drivers or techs consistently finish early you can adjust order durations and allow your business to complete more orders each day. You can select different time ranges, view specific drivers or techs one by one, or view them all together.
Data visualization makes it easy to track your key performance metrics for your team. These metrics include:
- Order status
- Arrival accuracy
- Order type
- Time worked
- Distance traveled
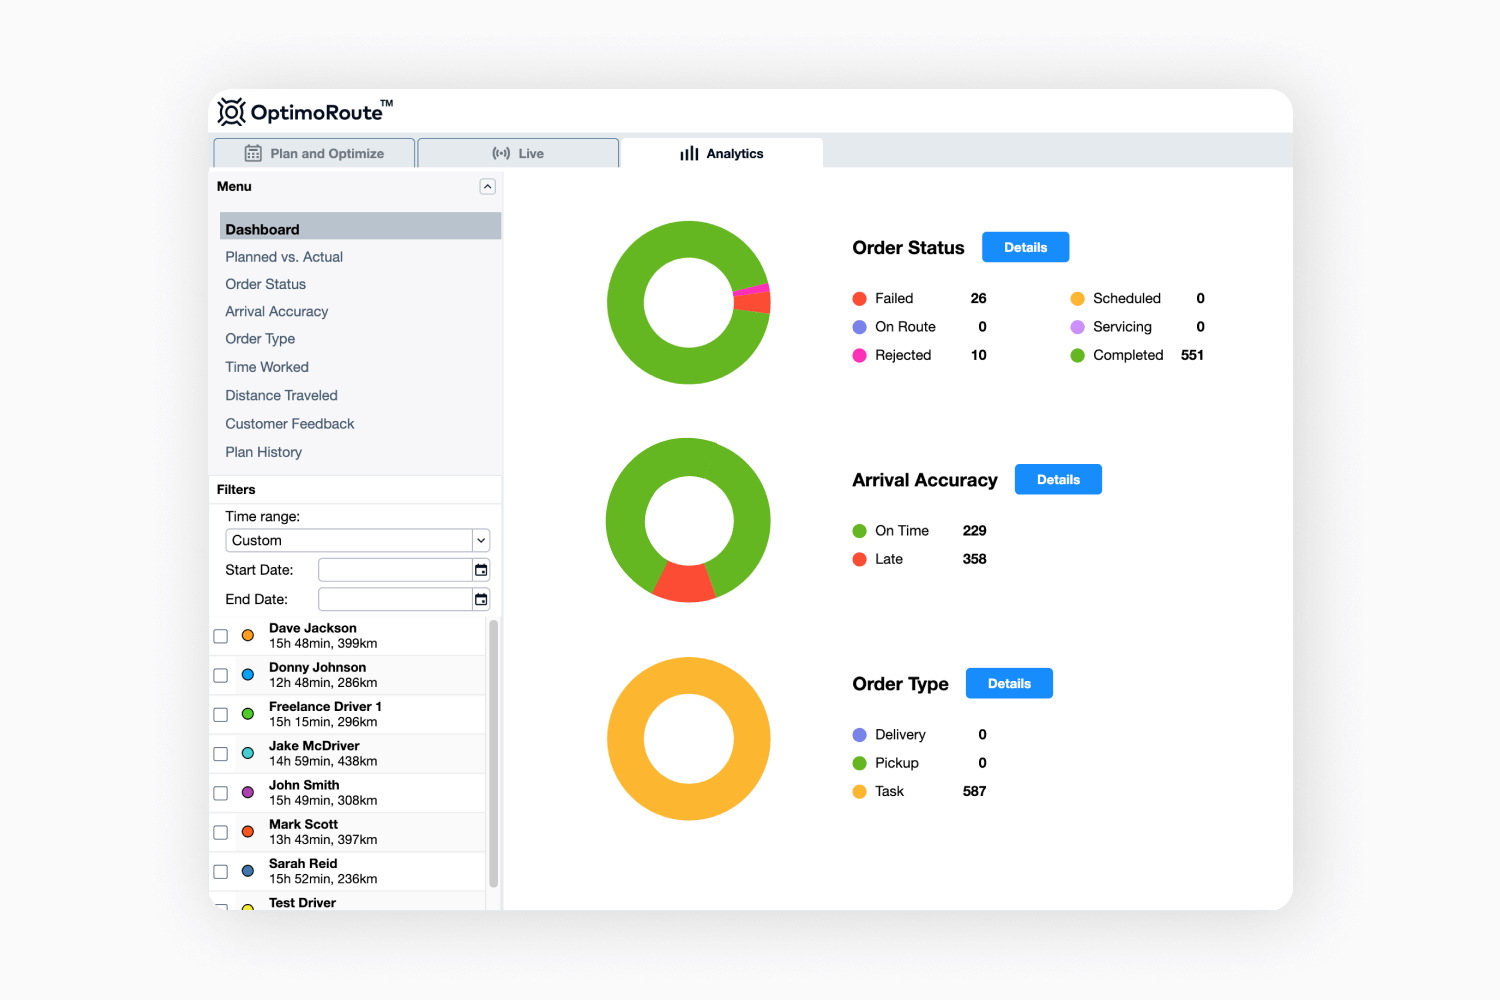
Historical Data Analysis
The platform retains historical data, allowing you to compare current performance with previous periods. This valuable information can help you identify long-term trends and assess the effectiveness of your optimization strategies.
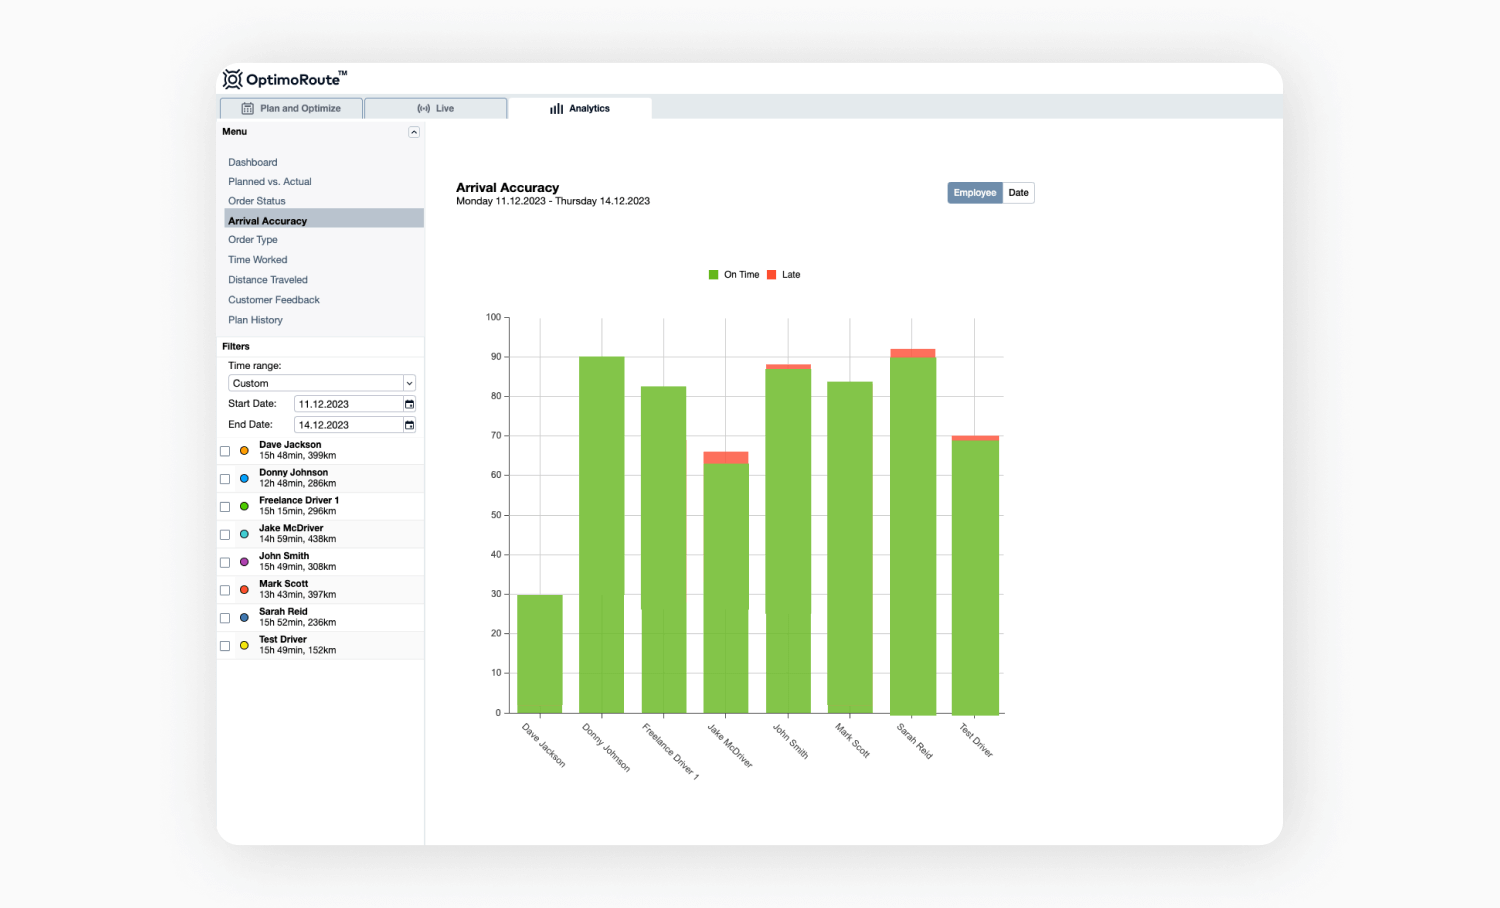
The different reports allow you to frame your drivers’ or techs’ current or historical data in a number of different ways, like Planned vs. Actual routes, Arrival Accuracy, or Distance Traveled.
Planned vs. Actual shows order by order, how your plan compares to real-time for each driver or tech. Using this view, you can pinpoint exactly where and when a certain team member falls behind, or why another one is always ahead.
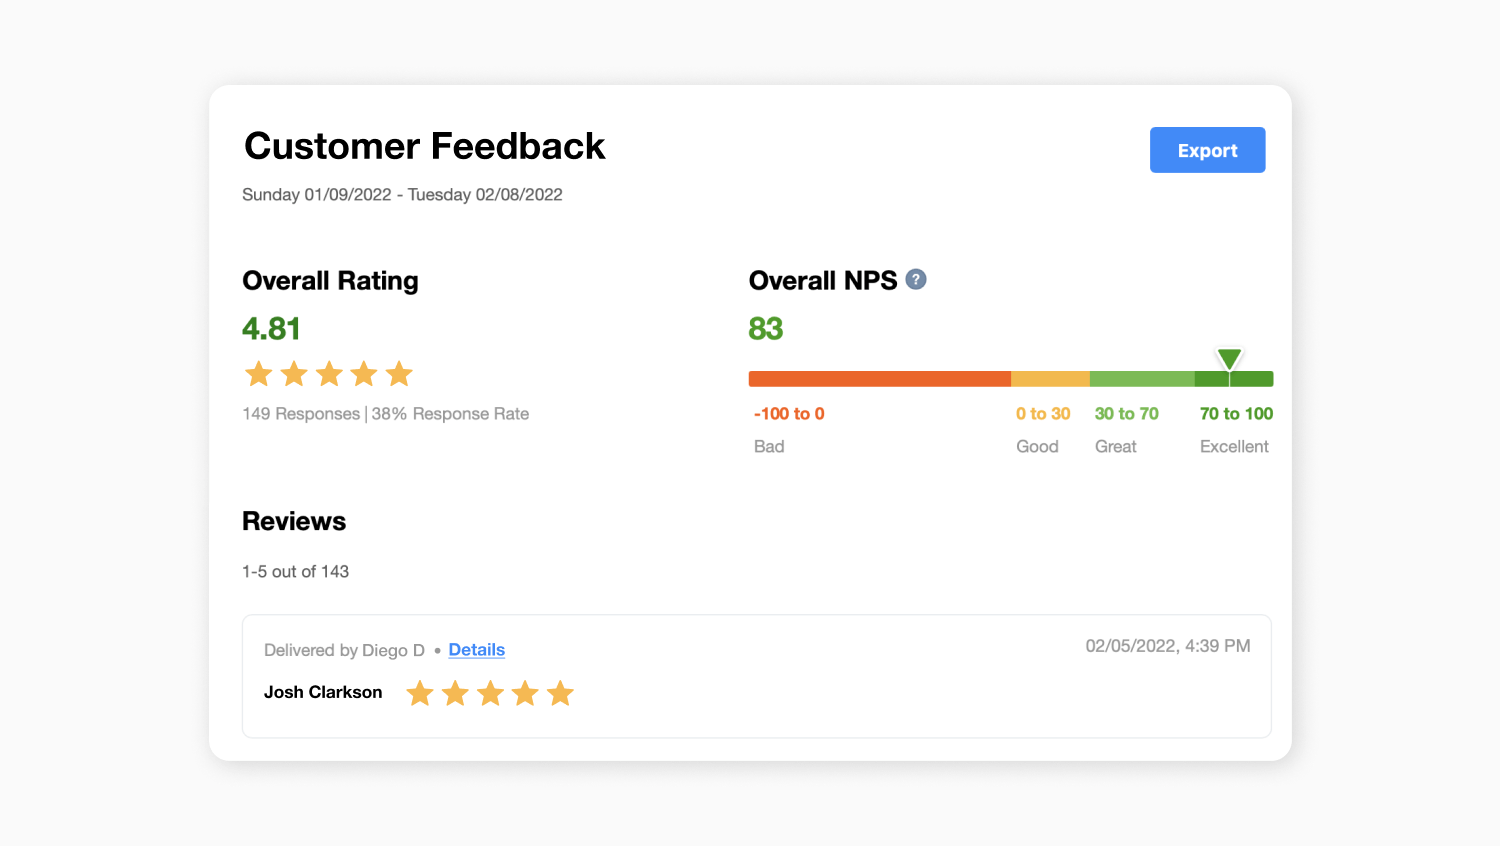
Customer Feedback
The Customer Feedback section of the Analytics dashboard allows you to view all collected feedback from your customers after a task or delivery has been completed. In the Customer Feedback tab, you can see your overall rating, NPS score, and each single review.
Cost Optimization
By analyzing data on distance traveled and time worked, Analytics can help you identify cost-saving opportunities. You can optimize routes to minimize fuel expenses and reduce wear and tear on your vehicles, ultimately saving money in the long run.
Real-Time Data
Analytics keeps up with your team in real-time. You can use the Analytics tab in OptimoRoute to follow the progress of all your drivers or technicians in one simple screen.
Data-Driven Decision Making
The analytics feature provides you with the information you need to make informed decisions and adapt to changing circumstances.
By harnessing the power of data, you can streamline your operations, reduce costs, and improve customer satisfaction. Whether you’re a small business or a large enterprise, the analytics dashboard in OptimoRoute can make a substantial difference in your day-to-day operations. Embrace data-driven decision-making, and take your logistics management to the next level with OptimoRoute.
Try OptimoRoute™ for Free
No installation or credit card required